Highlights
- Out of the 25 OECD countries analyzed, the ones with greater for-profit privatization in health care have worse outcomes for seven mortality indicators.
- The relationship between greater for-profit privatization and higher mortality rates is even clearer for the private delivery of health care services than for the private financing of health care services.
- The countries that combine high private financing and high private delivery of health care services have the worst life expectancy and mortality outcomes. Meanwhile, the countries with low private financing and low private delivery of health care services have the best outcomes. Countries with a mixed model place somewhere between those two ends of the spectrum.
- For-profit privatization as a variable seems to play a more significant role in life expectancy and mortality rates than health spending or income inequality.
- Canada, which is in the mixed country group, has rather mediocre life expectancy and mortality outcomes.
- The governments of several provinces, including Quebec, have expressed a desire to further privatize the financing and delivery of health care services, but that may have negative, rather than positive, impacts on population health.
Summary
As the governments of several Canadian provinces, including Quebec, are actively working to privatize health care services, this socio-economic brief sheds light on the effects of privatization by drawing a comparison between 25 OECD countries. More specifically, this brief provides an analysis of the relationship between for-profit privatization of these countries’ health care systems and a number of mortality indicators. The main finding of this analysis is unequivocal: there is a clear link between greater privatization and higher mortality rates, in terms of both the financing and the delivery of health care services.
Introduction
As Canadian public health systems have been plagued by service access issues for several years, Canadians are increasingly receptive to the suggestion that more of our health care system should be privatized, even though they feel wary of for-profit companies seeking to capitalize on illness.1“Public and Private Health Care,” Canadian Medical Association, https://www.cma.ca/our-focus/public-and-private-health-care/what-we-heard-surveys (accessed April 8, 2025); Fournier, Philippe J., “Les Québécois largement favorables au privé en santé (et les Canadiens aussi)” [Quebecers (and Canadians) largely in favour of private health care], L’Actualité, February 9, 2023, https://lactualite.com/politique/les-quebecois-largement-favorables-au-prive-en-sante-et-les-canadiens-aussi/; Fournier, Philippe J., “Les Québécois doutent du privé en santé” [Quebecers apprehensive about private health care], L’Actualité, February 15, 2024, https://lactualite.com/politique/les-quebecois-doutent-du-prive-en-sante/. These ideas are notably put forward by provincial governments that are actively working to privatize services.2Lajoie, Étienne, “Un plus grand nombre d’opérations se feront au privé en Ontario” [More surgeries going private in Ontario], Le Devoir, January 31, 2023, https://www.ledevoir.com/societe/sante/779866/sante-un-plus-grand-nombre-d-operations-se-feront-au-prive-en-ontario; Taschereau, Laurence, “L’Alberta accélère la cadence de privatisation des opérations chirurgicales” [Alberta moves faster to privatize surgical procedures], Radio-Canada, September 25, 2024, https://ici.radio-canada.ca/nouvelle/2107135/sante-public-prive-chirurgie-attente-liste; Carignan, AnneCharlotte, “Recourir au privé en santé : quelles conséquences au Manitoba ?” [What are the consequences of choosing private health care in Manitoba?], Radio-Canada, November 19, 2022, https://ici.radio-canada.ca/nouvelle/1933941/pc-npd-privatisation-hopitaux-cliniques-winnipeg-chirurgie.
In Quebec, the government recognizes the negative impacts of using private personnel placement agencies and of the exodus of doctors to the private sector—to the point that it has chosen to legislate to discourage these practices.3Cousineau, Marie-Eve, “Le début de la fin pour les agences de placement” [The beginning of the end for placement agencies], La Presse, April 1, 2025, https://www.lapresse.ca/actualites/sante/2025-04-01/reseau-public-de-sante/le-debut-de-la-fin-pour-les-agences-de-placement.php; Labbé, Jérôme, “Les médecins formés au Québec devront travailler 5 ans au public” [Quebec med school graduates to be required to spend 5 years in the public system], Radio-Canada, December 3, 2024, https://ici.radio-canada.ca/nouvelle/2124149/medecins-public-prive-quebec-projet-loi-83. And yet, despite its own conclusions on the detrimental effect of privatization, the Quebec government is strongly pushing for even more of health care services, such as surgeries, telemedicine and home care, to be privatized.4Boily, Daniel and Gentile, Davide, “19 % des chirurgies sous-traitées au privé” [19% of surgeries outsourced to the private system], Radio-Canada, March 13, 2025, https://ici.radio-canada.ca/nouvelle/2147521/chirurgies-prive-public-attente-caq; Plourde, Anne, “Télémédecine : la porte grande ouverte à l’industrie privée” [Telemedicine: Doors open wide to the private industry], La Presse, January 18, 2023; Boily, Daniel and Gentile, Davide, “Le privé prêt à prendre en charge les listes d’attente en soins à domicile au Québec” [Private industry to take over home support waitlists in Quebec], RadioCanada, January 29, 2025, https://ici.radio-canada.ca/nouvelle/2135996/soins-domicile-prive-attente-caq;
Privatization advocates often use other countries as examples to defend the efficiency of private providers in improving services and access. Countries like Germany, Sweden, France and the Netherlands often come up as role models for Canada, whose tight regulations are said to stifle the growth of the private health care industry.5Guénette, Jasmin, Hjertqvist, Johan and Belzile, Germain, Health Care in Sweden: Decentralized, Autonomous, Competitive, and Universal, Montreal Economic Institute (MEI), June 2017; Faubert, Emmanuelle B., Non-Profit Health Care: Taking Inspiration from Europe, MEI, August 2024; Wittevrongel, Krystle, Eder, Conrad and Faubert, Emmanuelle B., International Health Perspectives: Comparing Primary Care in Canada, Germany, and the Netherlands, MEI, October 2024. These arguments sometimes rely on a poor understanding of the difference between for-profit and not-for-profit private models. Some of them even draw on examples of countries with not-for-profit private models to recommend greater for-profit privatization in Canada.6Faubert, Emmanuelle B., op. cit.
The purpose of this socio-economic brief is to shed light on the effects of health care privatization by drawing a comparison between different countries that goes beyond a few specific examples. More specifically, this brief provides an analysis drawing a connection between the for-profit privatization of the health care systems of 25 Organization for Economic Cooperation and Development (OECD) countries and a number of mortality indicators. The main finding of this analysis is unequivocal: there is a clear link between greater privatization and higher mortality rates, in terms of both the financing and the delivery of health care services.
Key data sources and indicators
The goal of this analysis is to determine whether there is a link between greater privatization of the financing and delivering of health care services and life expectancy and mortality rates. This comparison looks at 25 OECD countries—countries from the Global South and Eastern Europe were excluded from the analysis so as to ensure a more comparable sample.
The countries excluded from the sample had either a historical context of colonialism or neocolonialism in its many forms (Global South) or an abrupt transition from command economies to capitalist free-market economies (Eastern Europe). Colonialism must be considered a key social determinant of health, in that it has deep, long-lasting health ramifications, particularly because it places and maintains (with but a few exceptions7A number of countries included in the analysis, such as Canada, also have a history of colonization, but are now on the dominant side of the power equation. It must be noted that colonialism still has a nefarious impact on the health of Indigenous populations in Canada. However, these populations have become small minorities, due to the genocidal violence of colonization, so their health conditions are not reflected in national indicators, which are generally on par with those of other “Northern” or “Western” countries. For Canada, see, for example, Shaheen-Hussain, Samir, Plus aucun enfant autochtone arraché. Pour en finir avec le colonialisme médical canadien [Not a single other child taken. Enough of Canadian medical colonialism], Montréal, Lux, 2021, 482 p.) colonized countries in asymmetric power relations.8Czyzewski, Karina, “Colonialism as a Broader Social Determinant of Health,” The International Indigenous Policy Journal, vol. 2, no. 1, 2011; Navarro, Vicente, “What We Mean by Social Determinants of Health,” International Journal of Health Services, vol. 39, no. 3, p. 423–441, 2009.
Similarly, the sudden transition to capitalism in post-Soviet countries, which has come to be known as the shock therapy approach in some countries due to how radical and abrupt the changes were, had major negative consequences on health, with an estimated excess mortality of seven million people in the years following the transition.9Stuckler, David, King, Lawrence and Mckee, Martin, “Mass Privatisation and the Post-Communist Mortality Crisis,” The Lancet, no. 373, 2009, p. 399–407; Scheiring, Gábor, “Deindustrialisation and the Post-Socialist Mortality Crisis,” Cambridge Journal of Economics, vol. 47, no. 2, 2023, p. 341–372. Although some countries have seen remarkable improvement, these effects linger to this day and help explain the persistent health gap between Eastern European and Western European health indicators.10Halfmann, Sebastian and Brand, Helmut, “Is the Health Gap Between Western and Eastern European Countries Still Increasing 25 Years After the Fall of the Iron Curtain? Myth or Reality?,” European Journal of Public Health, vol. 24, no. 2, 2014; Bíró, Anikó and Branyiczki, Réka, “Transition Shocks During Adulthood and Health a Few Decades Later in Post-Socialist Central and Eastern Europe,” BMC Public Health, no. 698, 2020, https://bmcpublichealth.biomedcentral.com/articles/10.1186/s12889-020-08839-7.
The privatization of the financing of health care services is measured based on the proportion of total health spending that is not funded by government transfers or social insurance contributions. These private expenditures consist mainly of individual or employer contributions to private insurance plans and out-of-pocket health spending by households. The data on the private financing of health care services was taken from available OECD health statistics, the most recent of which are from 2021.11OECD, Health at a Glance 2023, OECD Indicators, 2023, figure 7.12, https://www.oecd.org/en/publications/health-at-a-glance-2023_7a7afb35-en.html.
The privatization of the delivery of health care services is measured based on the total number of for-profit private hospitals. The choice to factor only hospitals in this metric is due to the fact that there is no exhaustive data on the involvement of private providers in health care services as a whole, but many sources do provide data that can be used to determine the percentage of for-profit private hospitals.
The Statista platform provides recent data (2022–23) on the total number of hospitals and the total number of for-profit and not-for-profit private hospitals in most of the countries considered in the analysis. This data converges with the data from an article from 2020.12“Total number of hospitals in select countries worldwide in 2023,” Statista, https://www.statista.com/statistics/1107086/total-hospital-number-select-countries-worldwide/ (accessed April 8, 2025); “Total number of not-for-profit and for-profit privately owned hospitals in select countries worldwide in 2022,” Statista, https://www.statista.com/statistics/1117592/total-privately-owned-hospital-number-select-countries-worldwide/ (accessed April 8, 2025); Paris, Valérie, “Les comparaisons internationales des hôpitaux : apports et limites des statistiques disponibles” [International comparisons of hospitals: What the available data can and cannot show], Revue française d’administration publique, no. 174, 2020, p. 363–384. Other sources, such as the International Trade Administration, the European Observatory on Health Systems and Policies, and a number of research reports were used to round out the data.13“Healthcare Resource Guide—Denmark,” International Trade Administration, https://www.trade.gov/healthcare-resource-guide-denmark (accessed April 8, 2025); “Healthcare Resource Guide—Sweden,” International Trade Administration, https://www.trade.gov/healthcare-resource-guide-sweden (accessed April 8, 2025); European Observatory on Health Systems and Policies, “Denmark Health System Review,” Health Systems in Transition, vol. 26, no. 1, 2024; European Observatory on Health Systems and Policies, “Sweden Health System Review,” Health Systems in Transition, vol. 25, no. 4, 2023; European Observatory on Health Systems and Policies, “Luxembourg Health System Review,” Health Systems in Transition, vol. 26, no. 4, 2024; European Observatory on Health Systems and Policies, “Switzerland Health System Review,” Health Systems in Transition, vol. 17, no. 4, 2015; Asia Pacific Observatory on Health Systems and Policies, “Japan Health System Review,” Health Systems in Transition, vol. 8, no. 1, 2018; “Specialist health service. Expenses and revenues, by type of service and health enterprise 2006-2023,” Statistics Norway, https://www.ssb.no/en/statbank/table/14022/ (accessed April 9, 2025); Sperre Saunes, Ingrid, Karanikolos, Marina and Sagan, Anna, “Norway Health System Review,” Health Systems in Transition, vol. 22, no. 1, 2020; “List of hospitals in Norway,” Wikipedia, https://en.wikipedia.org/wiki/List_of_hospitals_in_Norway (accessed April 9, 2025); Moir, Mackenzie and Barua, Bacchus, The Role of Private Hospitals in Australia’s Universal Health Care System, Fraser Institute, 2024, https://www.fraserinstitute.org/sites/default/files/role-private-hospitals-in-australias-universal-health-care-system.pdf.
These two indicators of the privatization of health care services were cross-referenced with the seven mortality indicators for which OECD provides data for all of the countries considered in the analysis (with but a few exceptions):
- Life expectancy (years of life at birth)
- Avoidable mortality—treatable deaths (per 100,000 people, age-standardized)
- Avoidable mortality—preventable deaths (per 100,000 people, age-standardized)
- Maternal mortality (deaths per 100,000 live births)
- Infant mortality (deaths per 1,000 live births)
- Thirty-day mortality following acute myocardial infarction (AMI) (per 100 admissions for people aged 45 and over, age- and sex-standardized)
- Thirty-day mortality following ischaemic stroke (per 100 admissions for people aged 45 and over, age- and sex-standardized)14OECD, op. cit.
Mortality and private financing of health care services
Figure 1 shows the percentage of privately financed health care services in the 25 OECD countries chosen. For the countries considered, health expenditures financed by private sources average 25.8 per cent of total health spending. The countries were divided into two groups for the purposes of the analysis. Countries with a percentage of private financing below this average were placed in the low private financing group, while those with a percentage of private financing above the average were placed in the high private financing group.
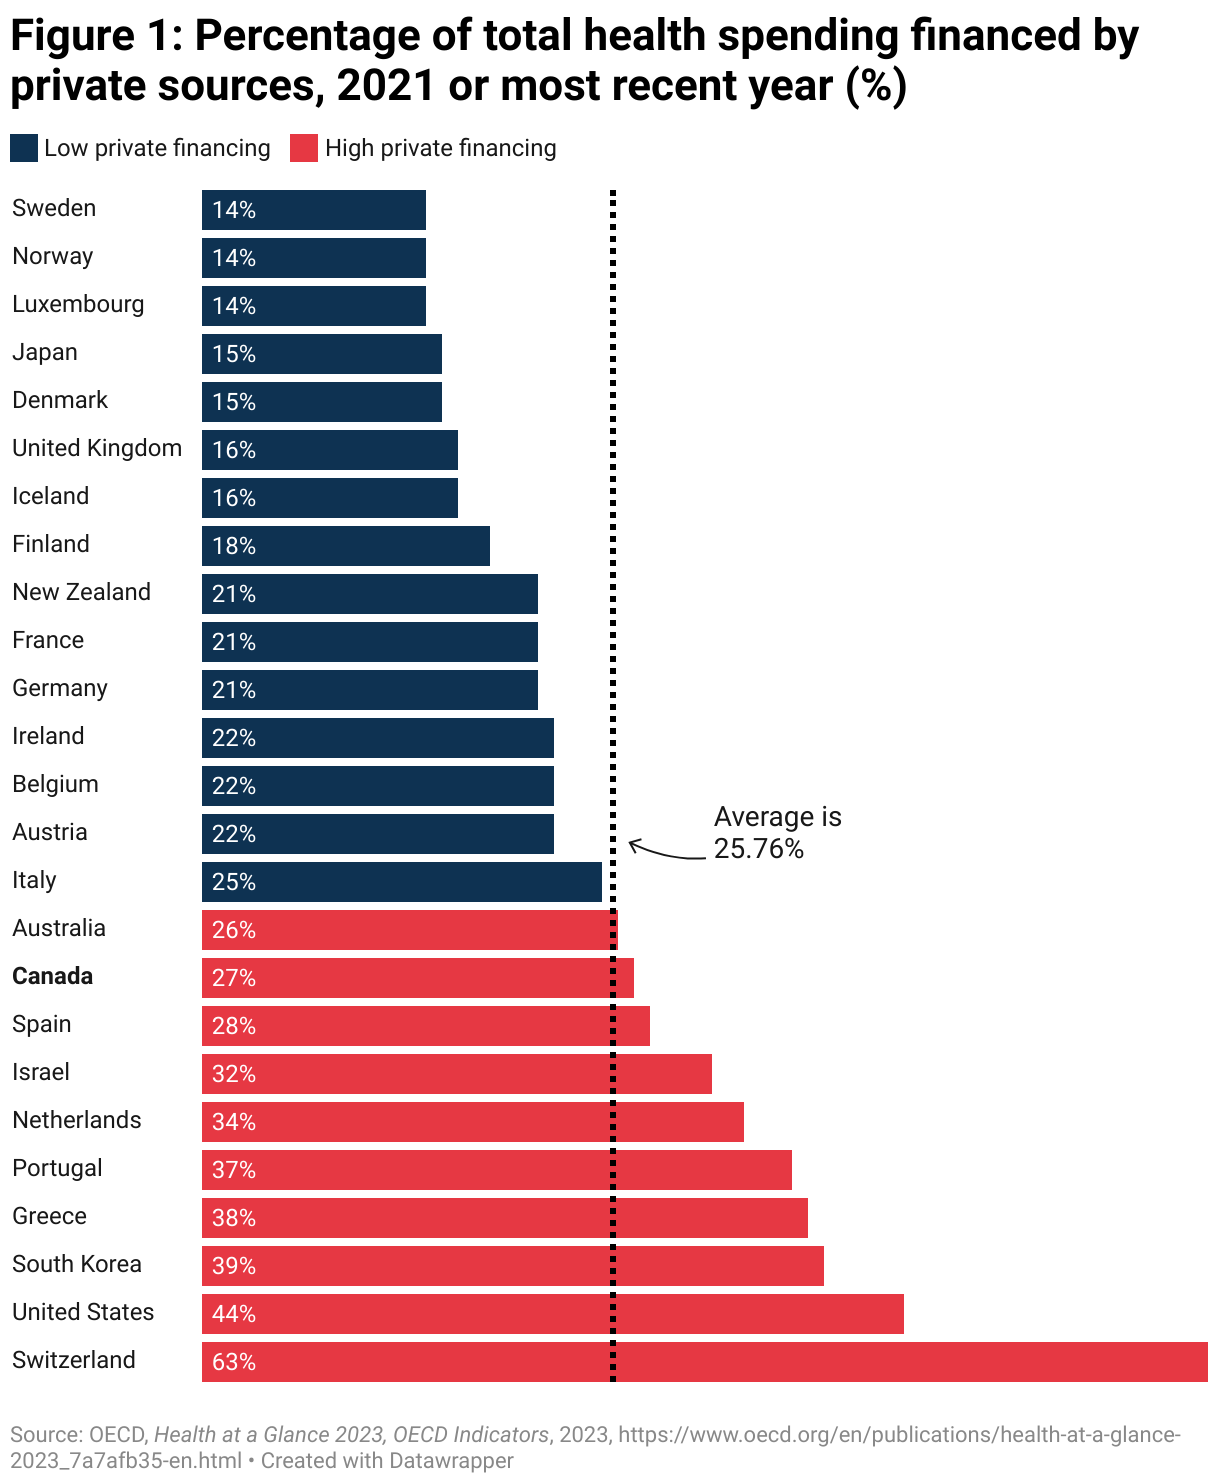
Unsurprisingly, the United States, with over 45 per cent of total health spending receiving private financing, is one of the countries with high privatization rates, second only to Switzerland’s 64 per cent. Just as predictably, Nordic countries such as Sweden, Norway and Denmark are on the other end of the spectrum, with just between 14 per cent and 15 per cent in private financing for health expenditures.
What is maybe more surprising is the fact that Canada, generally considered a country with low privatization rates, is in fact among the countries with high private financing. With private sources financing 27 per cent of its total health spending, Canada is close to the average. This percentage was 24.3 per cent in Quebec in 2021, and the difference can be explained by the surge in government spending caused by the pandemic. It went up to 27.4 per cent in 2024.15Canadian Institute for Health Information, National Health Expenditure Trends, 2024: Data tables—Series B, 2024.
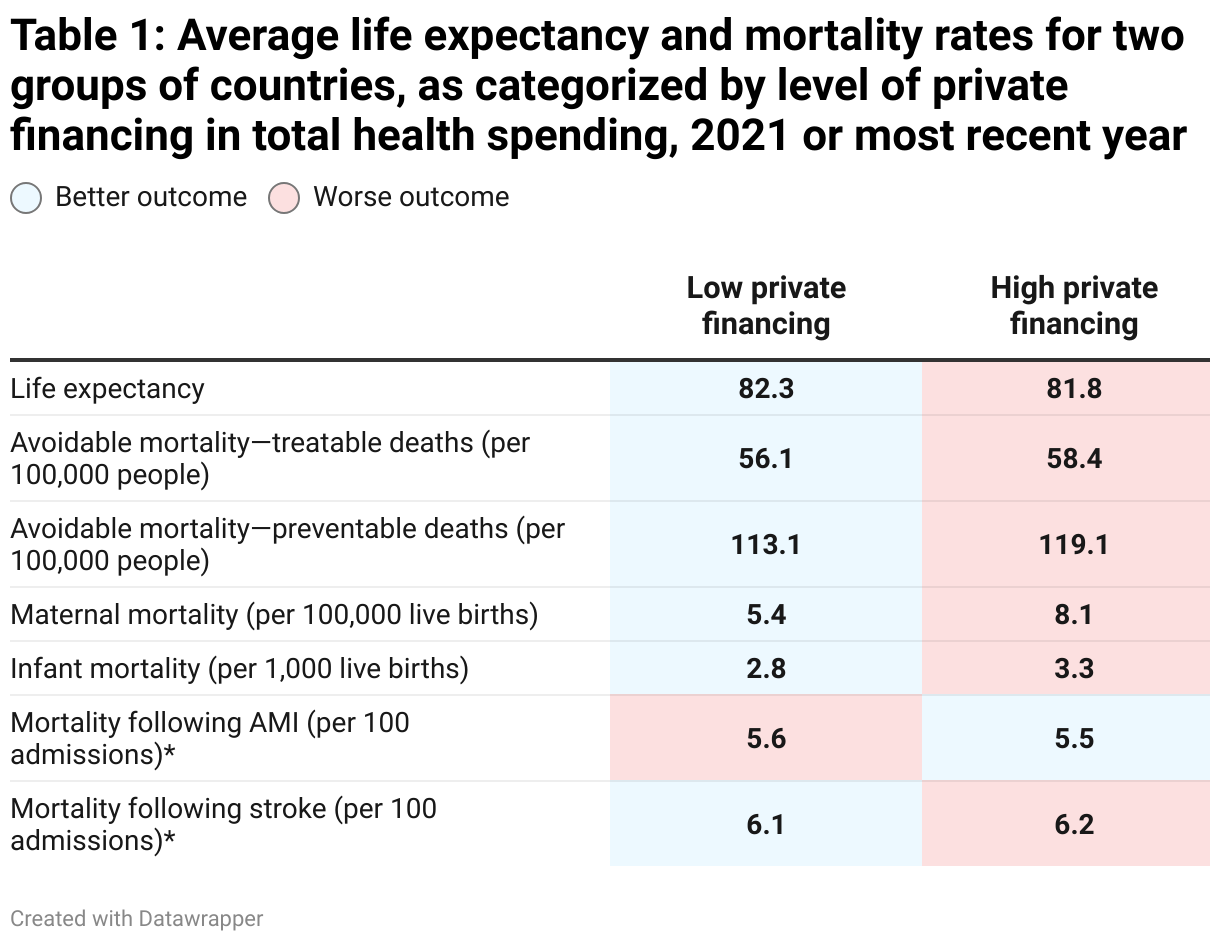
Table 1 illustrates the average life expectancy and mortality rates for countries in each group for the seven indicators used in the analysis. The average life expectancy is lower and average mortality rates are generally higher in the high private financing group than in the low private financing group. The only exception is mortality following AMI, although like with mortality following a stroke, the difference is very small.
However, like any metric, averages are an imperfect measurement that may lead to certain distortions. Countries with outlier results may significantly skew the average up or down, which can reduce the representativeness of the sample. In order to offset the potential biases of averages as a metric, a second metric was added: for each of the two groups, the proportion of countries that are above the general life expectancy and mortality rate average was also considered.
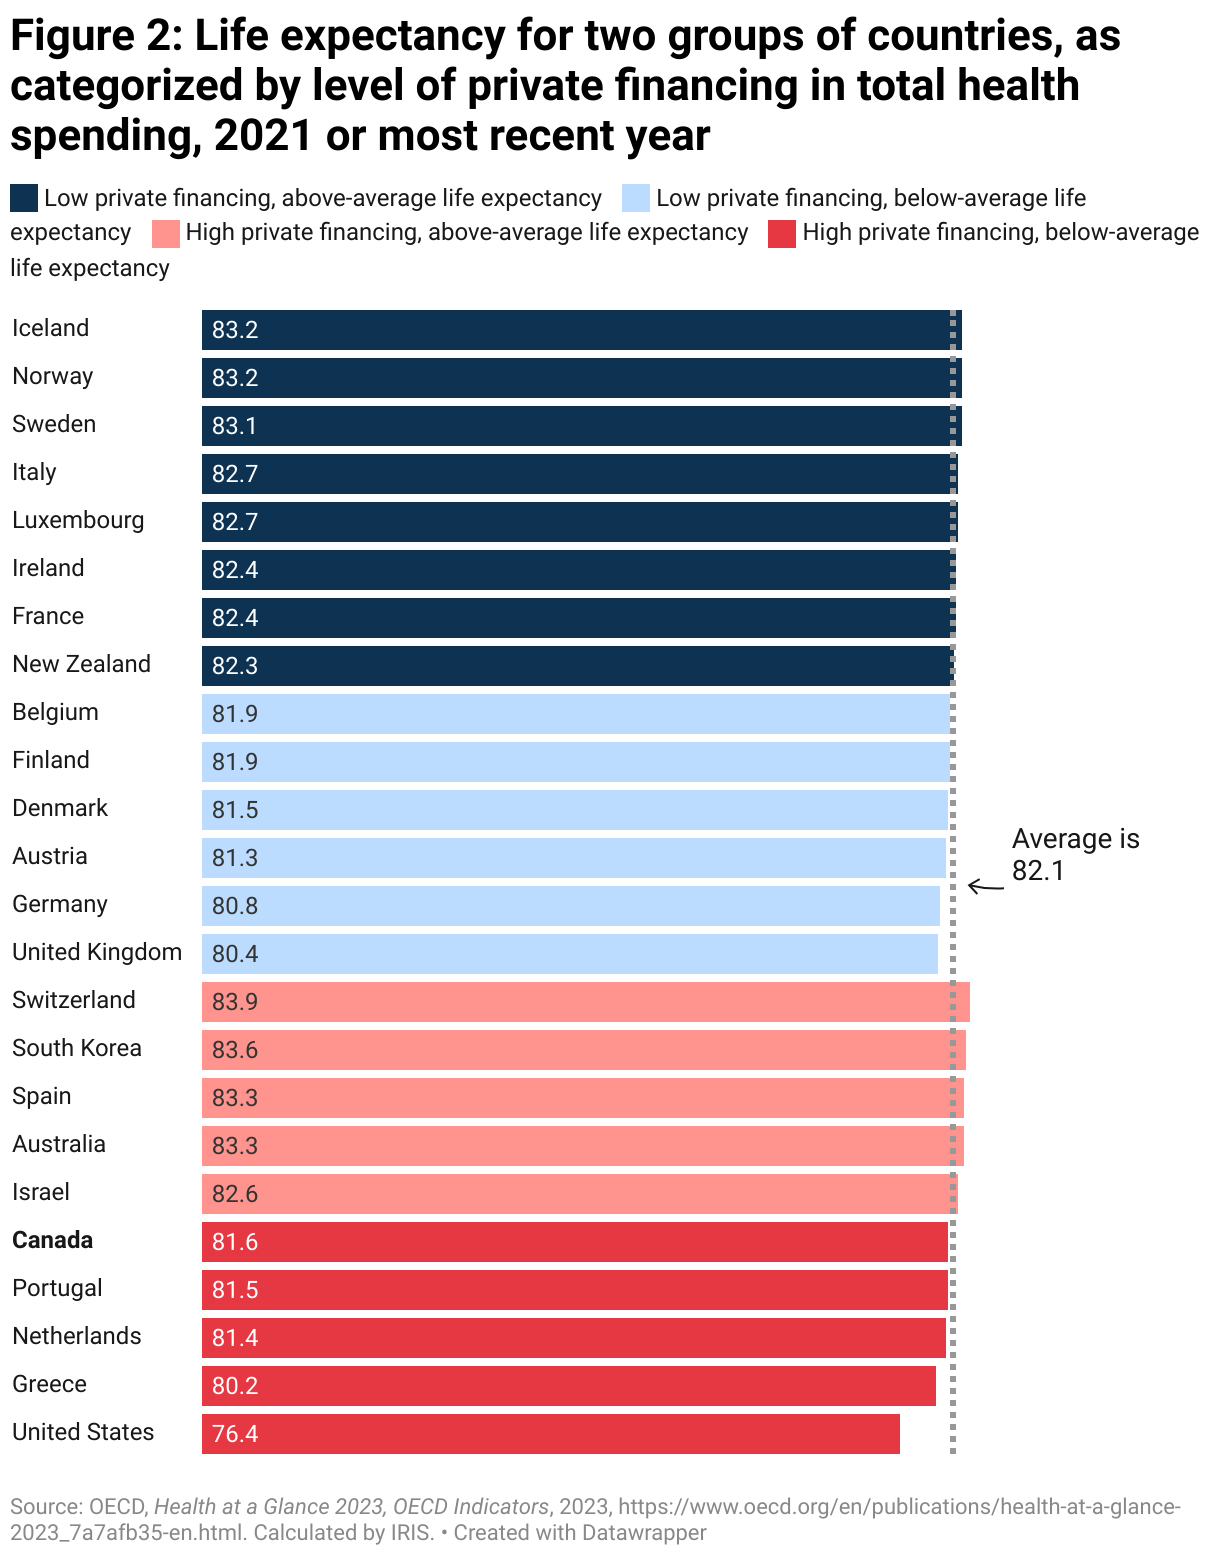
Figure 2 illustrates this process for the life expectancy indicator. In it, the countries are categorized by level of private financing, and the countries with an above-average life expectancy (the average being 82.1 years across the sample countries) are represented by the darker bars. Out of the 10 countries with high private financing, five—or 50 per cent—have an above-average life expectancy. Out of the 15 countries with low private financing, nine countries—or 60 per cent—have an above-average life expectancy. The high private financing group, therefore, has worse outcomes than the low private financing group for this indicator.
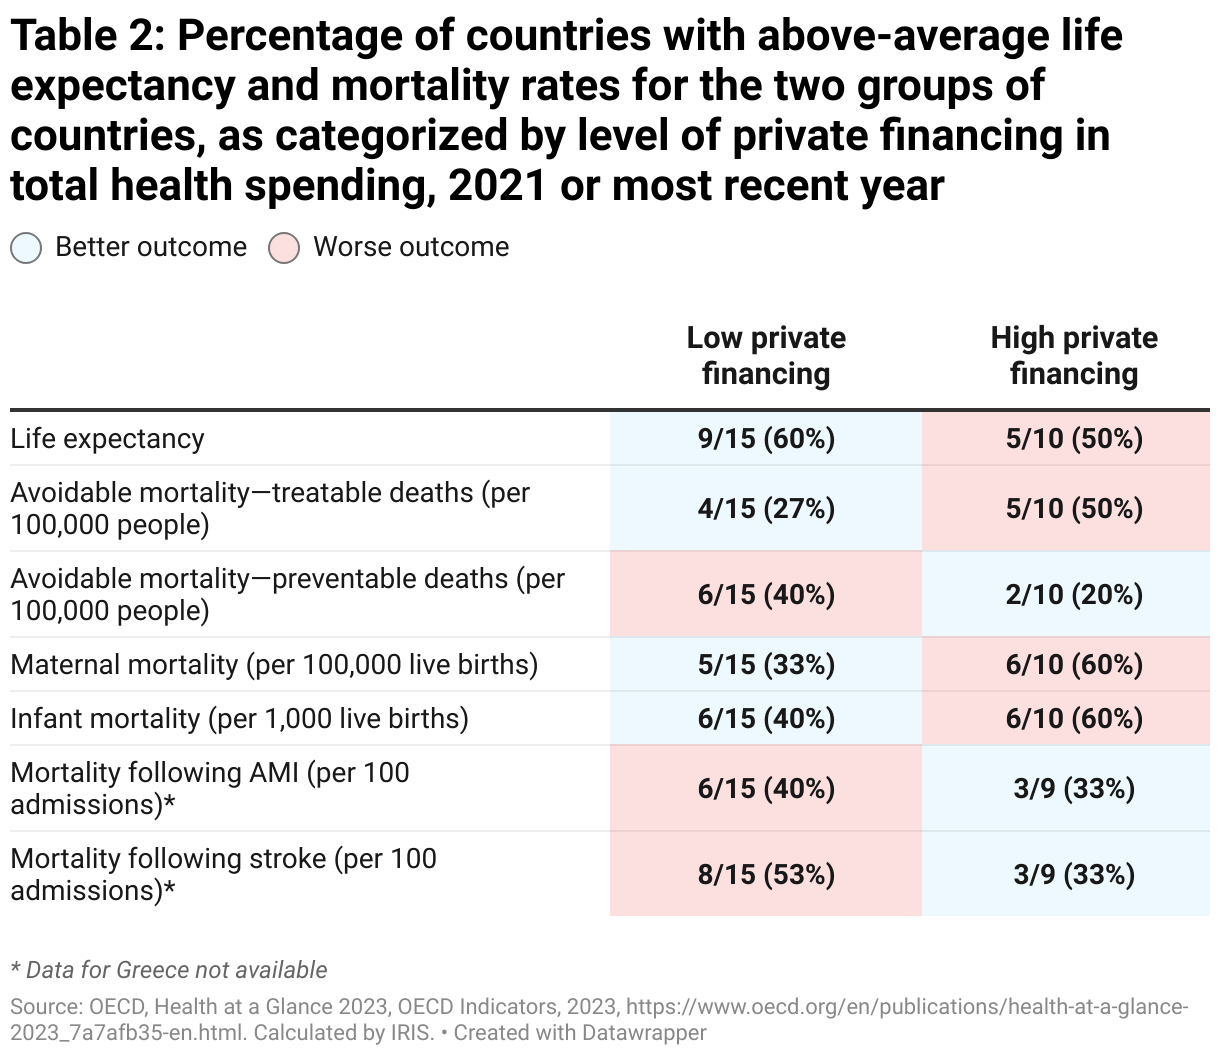
The outcomes for life expectancy and mortality indicators are presented in Table 2. This table shows less stark contrast than Table 1: the group of countries with low private financing has better outcomes for four of the seven indicators, whereas the group of countries with high private financing has better results for three indicators.
This is, of course, not a perfect metric either. The next sections will show that outcomes for the country groups are sometimes very close to each other and, in certain cases, a single country shifting positions relative to the average would be enough to reverse the results. This is why the best approach is to combine the two metrics used in the analysis.
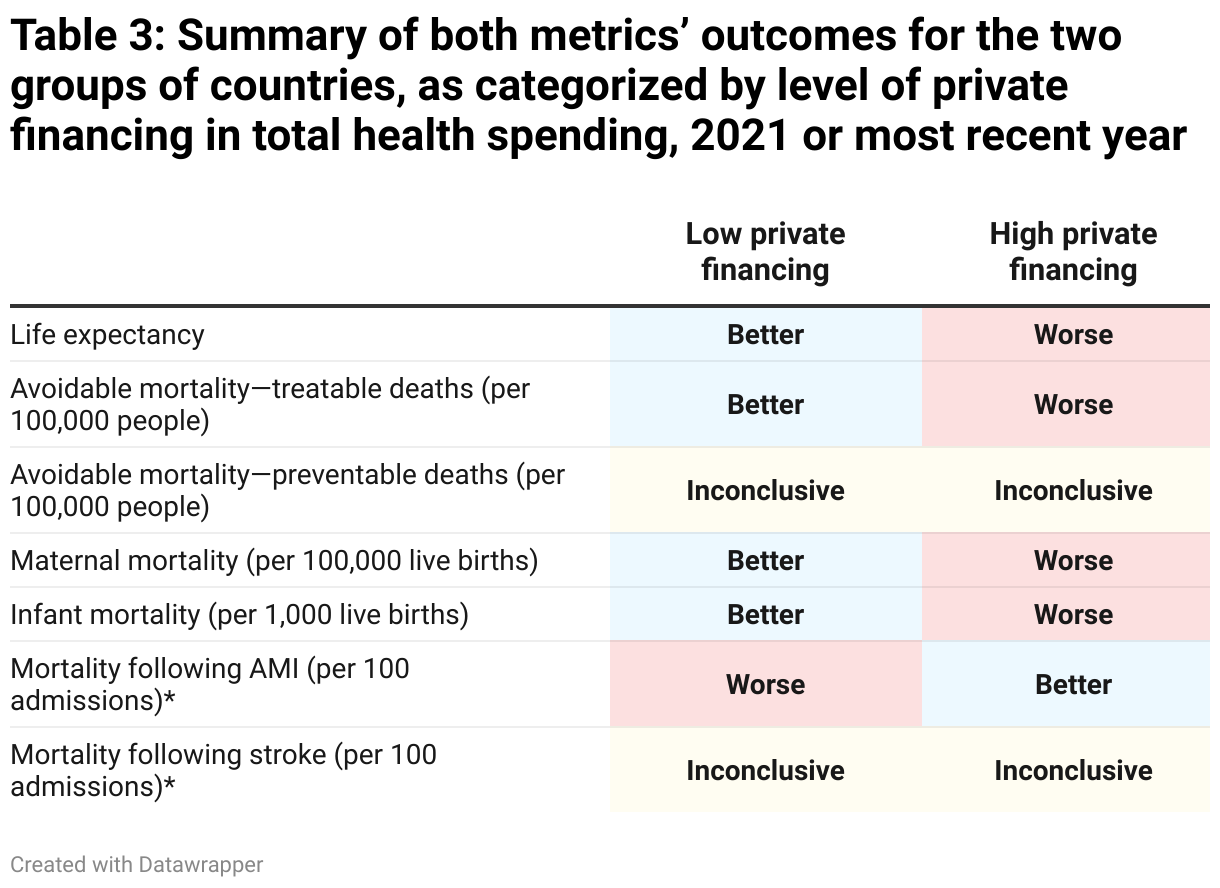
Table 3 summarizes the two metrics presented in Tables 1 and 2. An X means that both metrics show a poorer outcome for the group of countries compared with the other group. An Y means that both metrics show a better outcome. The results are considered inconclusive (I) when the two metrics diverge, which is the case for two of the seven indicators (preventable mortality and mortality following a stroke). When these two cases are excluded, the high private financing group has better outcomes for only one indicator, compared with four for the low private financing group.
Overall, the data analyzed shows a link between, on the one hand, greater privatization of the financing of health care services and, on the other hand, lower life expectancy and higher mortality rates. Let us now look at the relationship between mortality and greater privatization of the delivery of health care services.
Mortality and private delivery of health care services
The decision to privatize the financing of health care services, which means making users contribute to private insurance plans or pay out of pocket for health care services, is generally met with legitimate concern due to the financial barriers to access and the inequality caused by privatization. But privatizing the delivery of health care services is not met with the same concern, especially when the services provided by private players are covered by a public insurance plan that ensures free access to all users.16The facts show, however, that when the delivery of health care services is outsourced to for-profit private businesses, services are not guaranteed to be free, even when they are publicly financed and it is illegal to charge patients. See Plourde, Anne, “Le PL15 et le mirage de la gratuité des services privés” [Bill 15 and the illusion of free private health care services], IRIS, September 12, 2023, https://iris-recherche.qc.ca/blogue/sante/mirage-gratuite-services-prives/. There is an impression that outsourcing the delivery of health care services to the private sector has fewer negative consequences than privatizing the financing of health care services.
But what does this mean for mortality rates? The process described in the previous section can be reproduced to determine where there is a link between mortality rates and the privatization of health care service delivery.
Figure 3 illustrates the percentage of for-profit private hospitals in the 25 sample countries. As in the previous section, the countries are divided into two groups—low private delivery and high private delivery—based on what side of the average (24 per cent) they fall on.
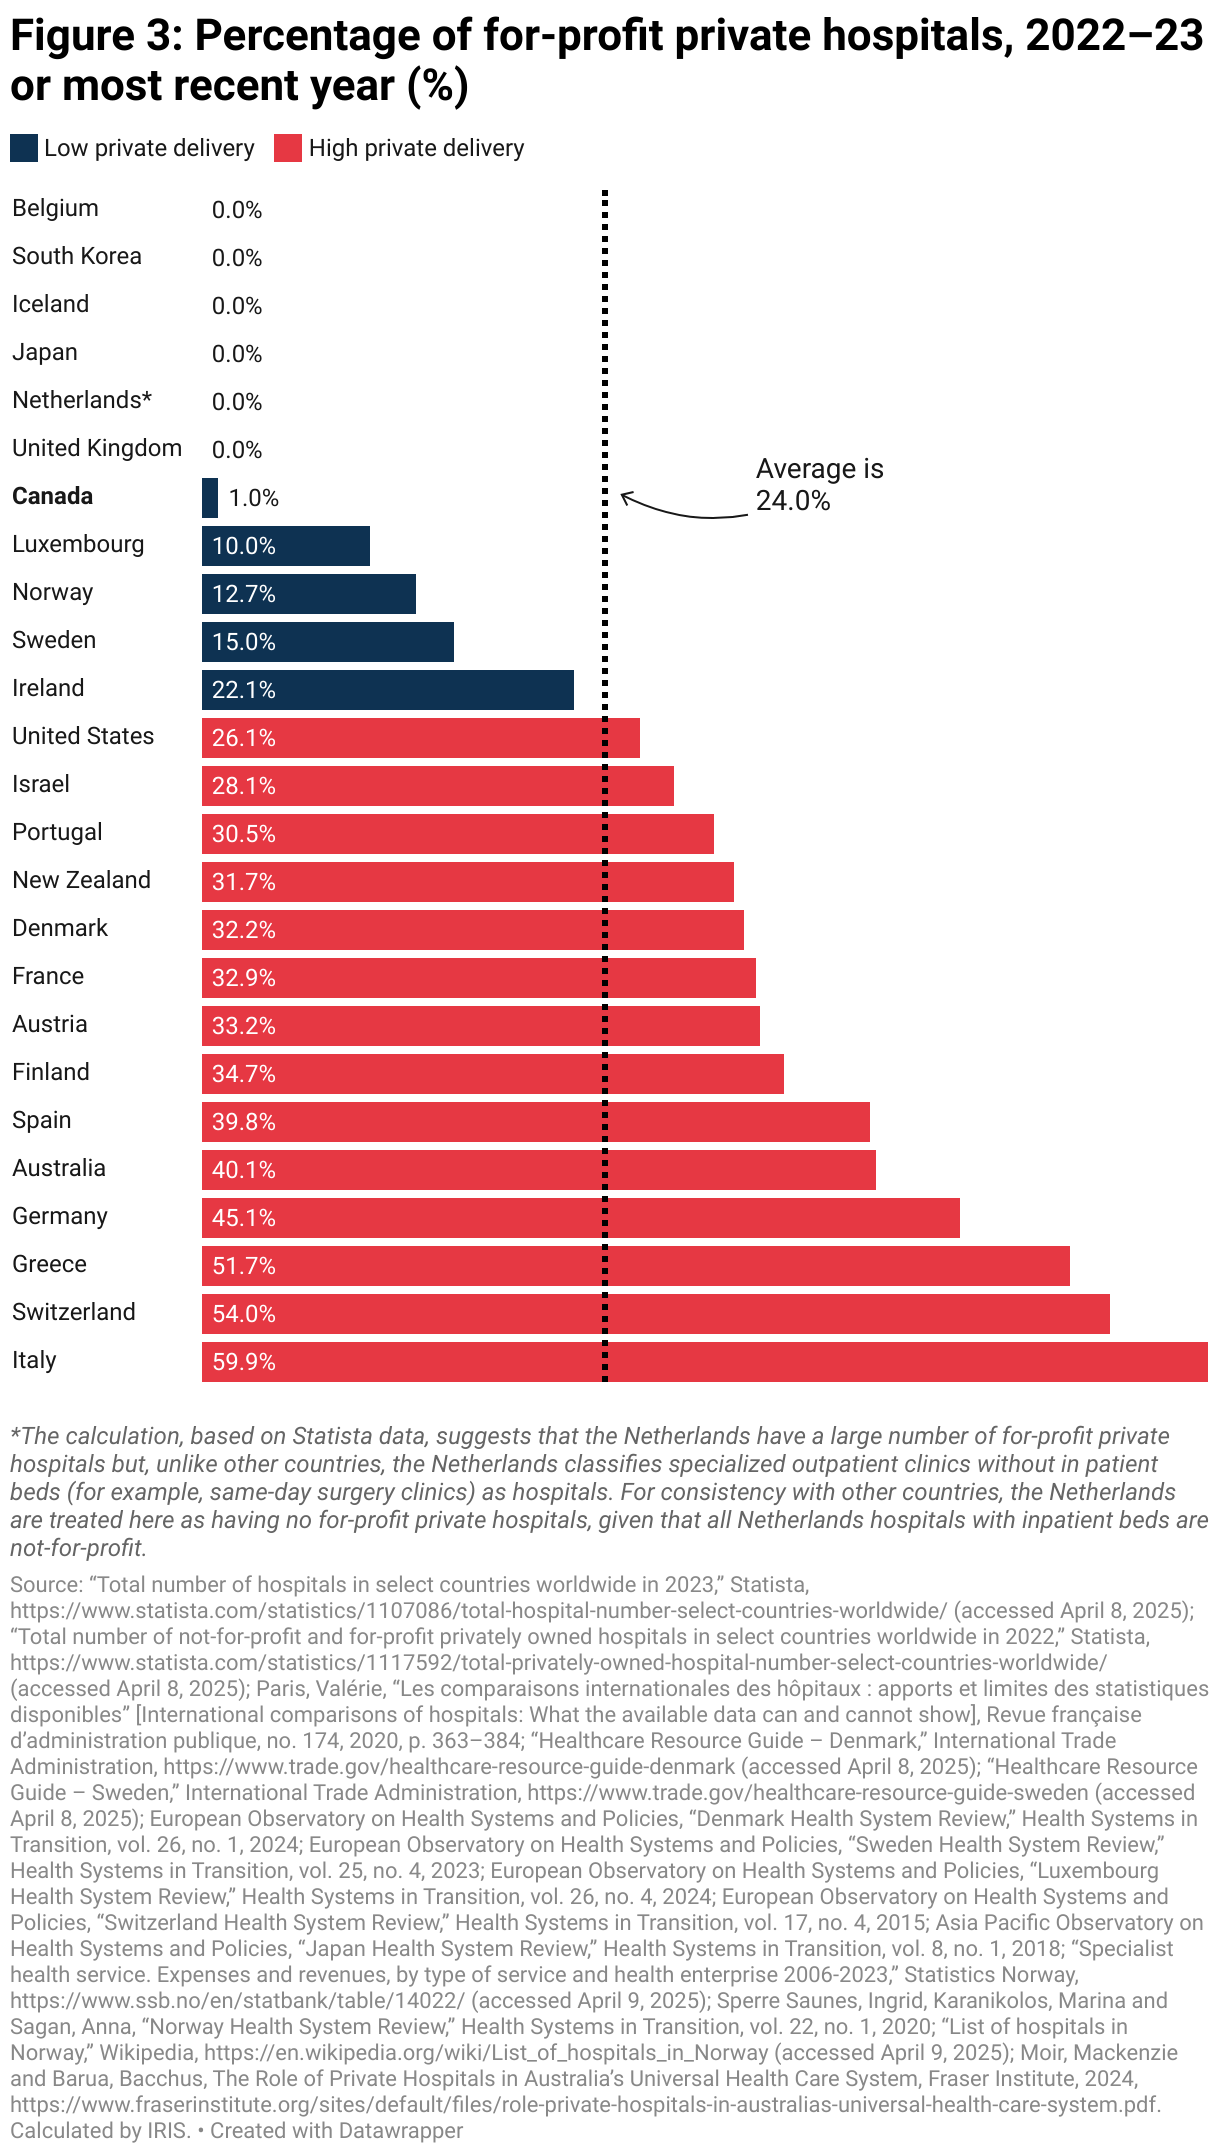
The overall picture is rather different from what we saw for the privatization of the financing of health care services. Of the 25 countries in the analysis, a majority (14) fall into the high private delivery group, whereas most fall in the low private financing group (see Figure 1). In addition, several countries do not have any for-profit private hospitals, even though, from a financing perspective, private providers have managed to maintain a presence in all countries.
A number of high private financing countries are also in the low private delivery group, and vice versa. For example, Denmark, one of the countries with the lowest private financing, has a significant percentage of health care services delivered by for-profit private providers, which own almost a third (32.2 per cent) of the country’s hospitals. However, this figure is somewhat overestimated, since available data for Denmark—and also for Sweden and Norway—does not distinguish between for-profit and not-for-profit private hospitals. As a result, all private hospitals in these three countries are counted as for-profit.17For Denmark and Sweden, this choice is based on European Observatory on Health Systems and Policies publications, which state that most private hospitals in these two countries are for-profit. For Norway, this was considered a more consistent and less risky methodological choice, given the relatively low number of hospitals concerned.
Once again, the United States unsurprisingly falls in the high private delivery group, but in the back of the pack, with 26.7 per cent of hospitals being for-profit private hospitals. While most (77.6 per cent) U.S. hospitals are privately owned, two-thirds are not-for-profit. Canada goes from high private financing to low private delivery, with just one per cent of its hospitals being privately owned.
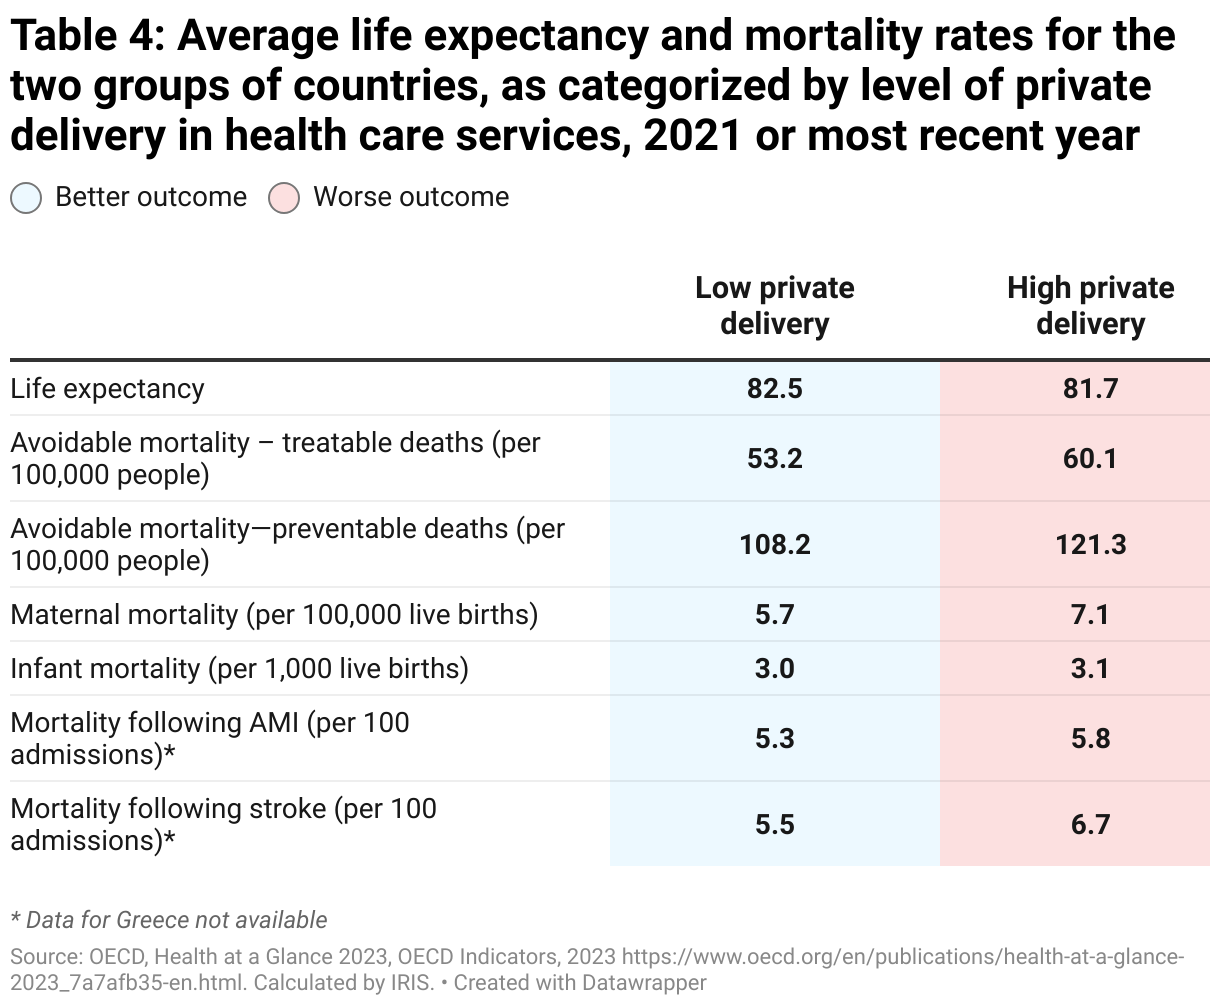
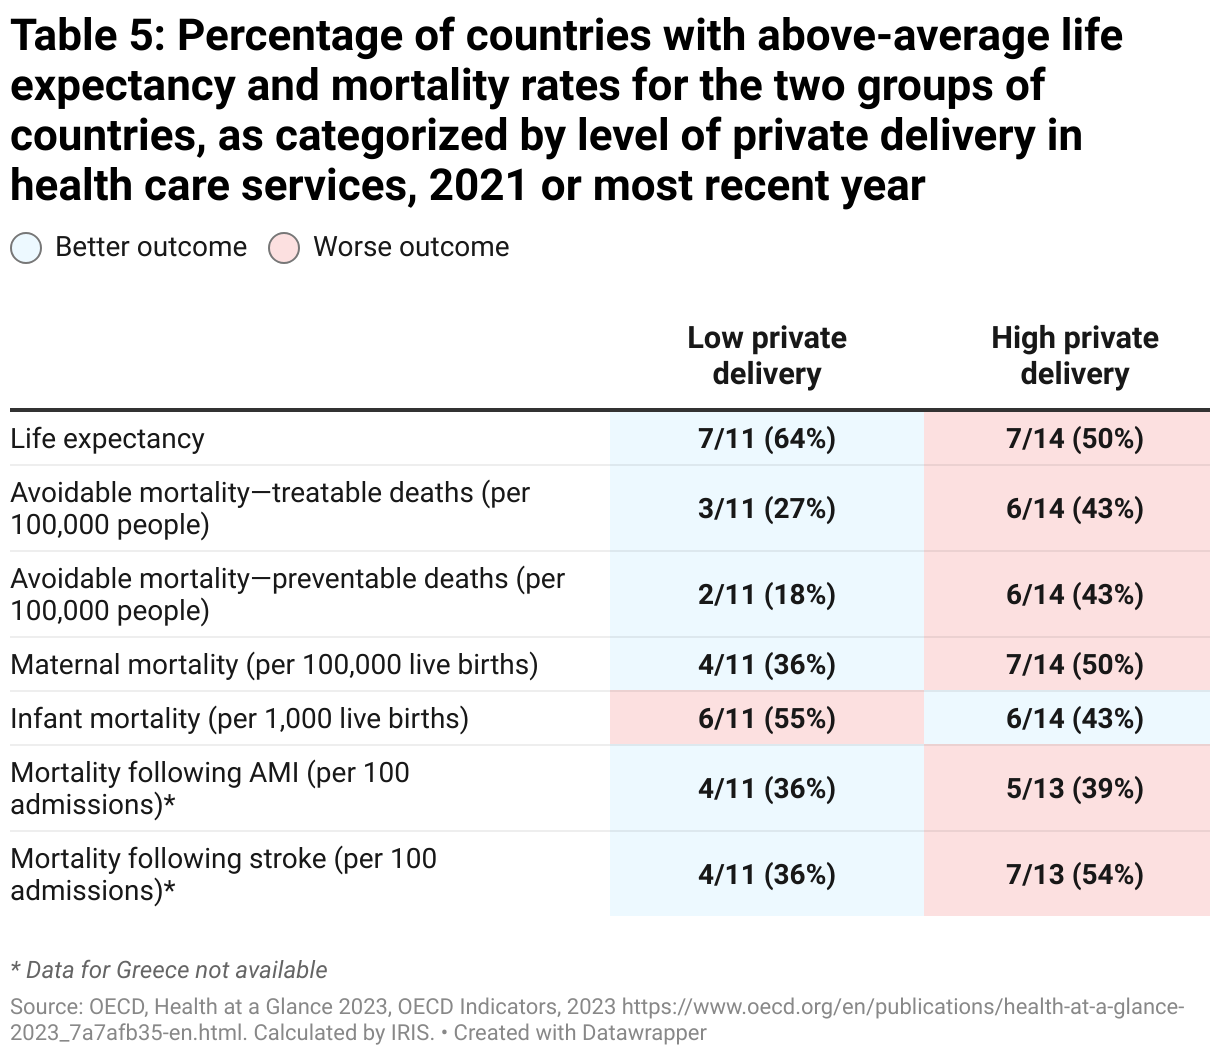
Tables 4 and 5 present each group’s outcomes for the two metrics used in the previous section. Table 6 summarizes the two metrics using the same criteria. Now, for the two metrics, the high private delivery group has lower outcomes than the low private delivery group for almost all indicators. The only exception is infant mortality, for which the outcomes are inconclusive. A number of indicators result in very similar outcomes (such as infant mortality and mortality following an AMI), but no indicators show a clear advantage for high private delivery countries.

Surprisingly, while privatizing the delivery of health care services is generally perceived as less problematic than privatizing the financing of health care services, the analysis conducted so far shows that the links between high privatization and high mortality rates are even stronger when the delivery of health care services is privatized than when their financing is privatized.
Mortality and country groups by high, mixed and low private health care services financing and delivery
Now let us see what mortality outcomes are found when cross-referencing both variables: private health care services financing and private health care services delivery. For this analysis, the countries under review were categorized into three groups, shown in Table 7: countries with low private financing and low private delivery (low privatization group), countries with high private financing and high private delivery (high privatization group), and countries with a mix of either high private financing and low private delivery, or low private financing and high private delivery (mixed group).
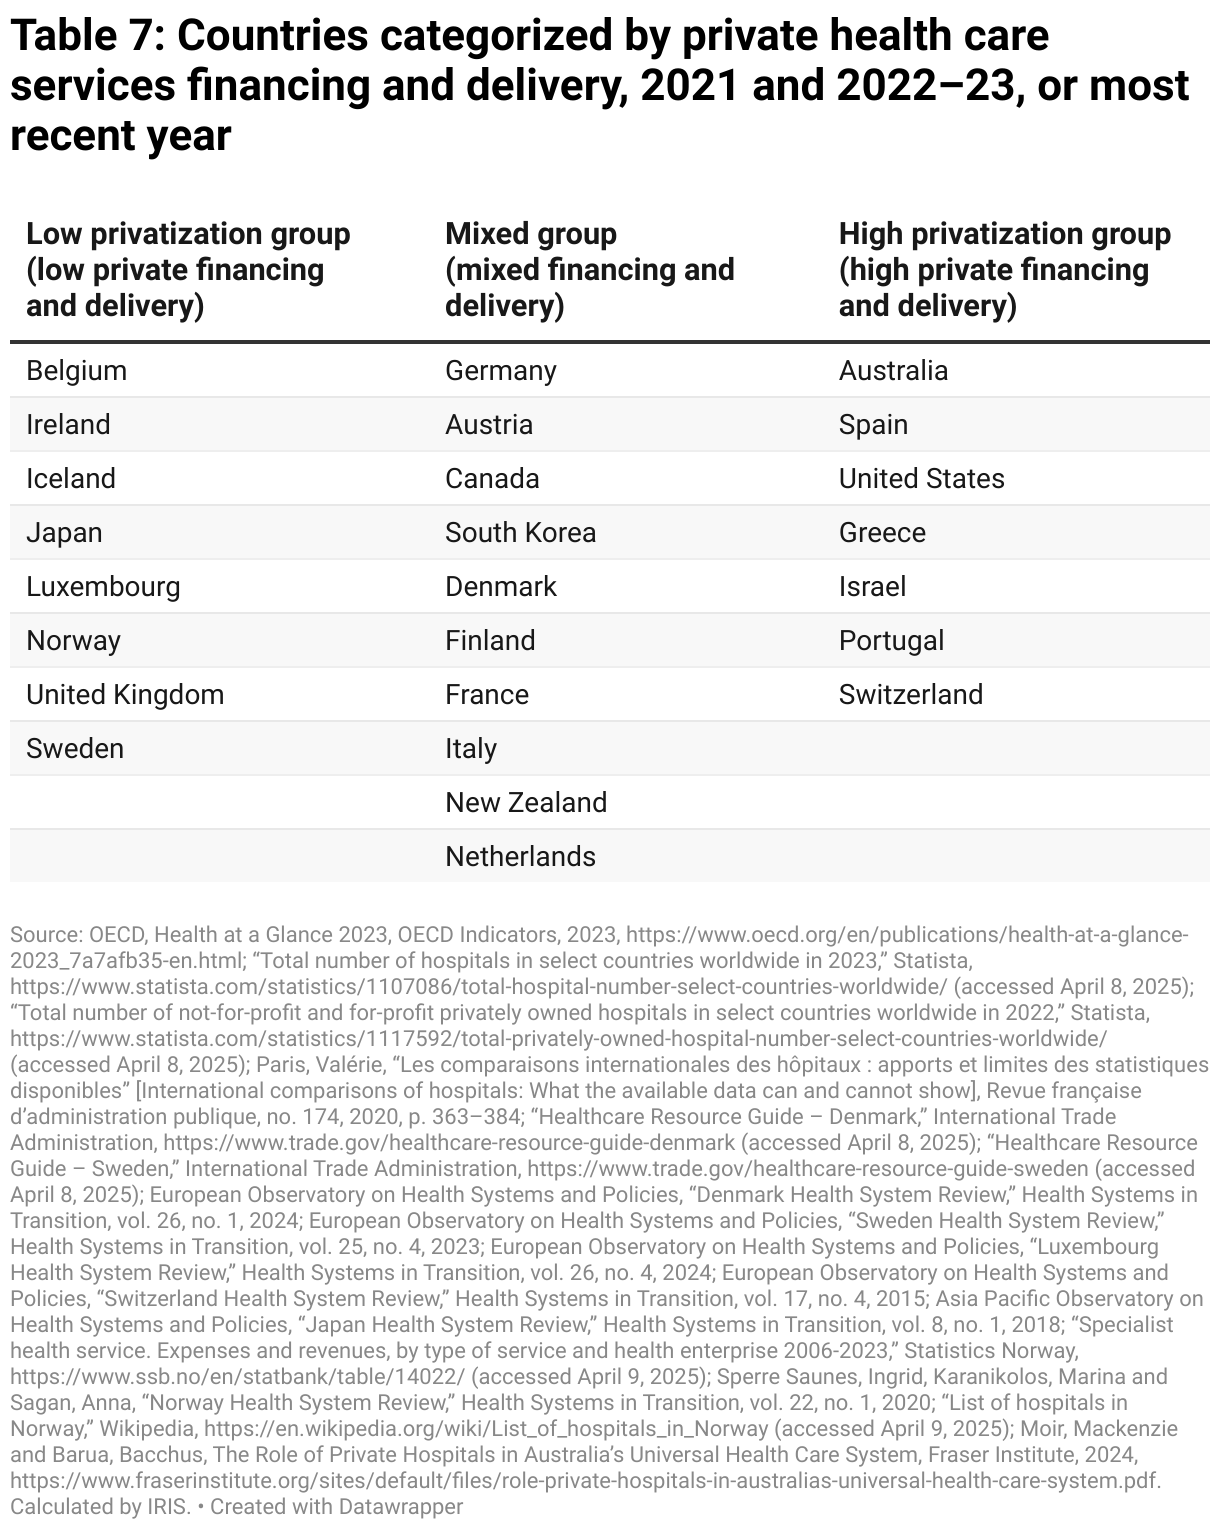
The mixed group is the largest, with 10 of the 25 countries being analyzed, and includes Canada, which has high private financing and low private delivery. The low privatization group contains eight of the 25 countries being analyzed, and the high privatization group is made up of seven of the countries, making it the smallest.
Table 8 provides the average life expectancy and mortality rates for each of these groups of countries. As shown by these numbers, the low privatization group has the best outcomes across all indicators, closely followed by the mixed group for certain indicators.
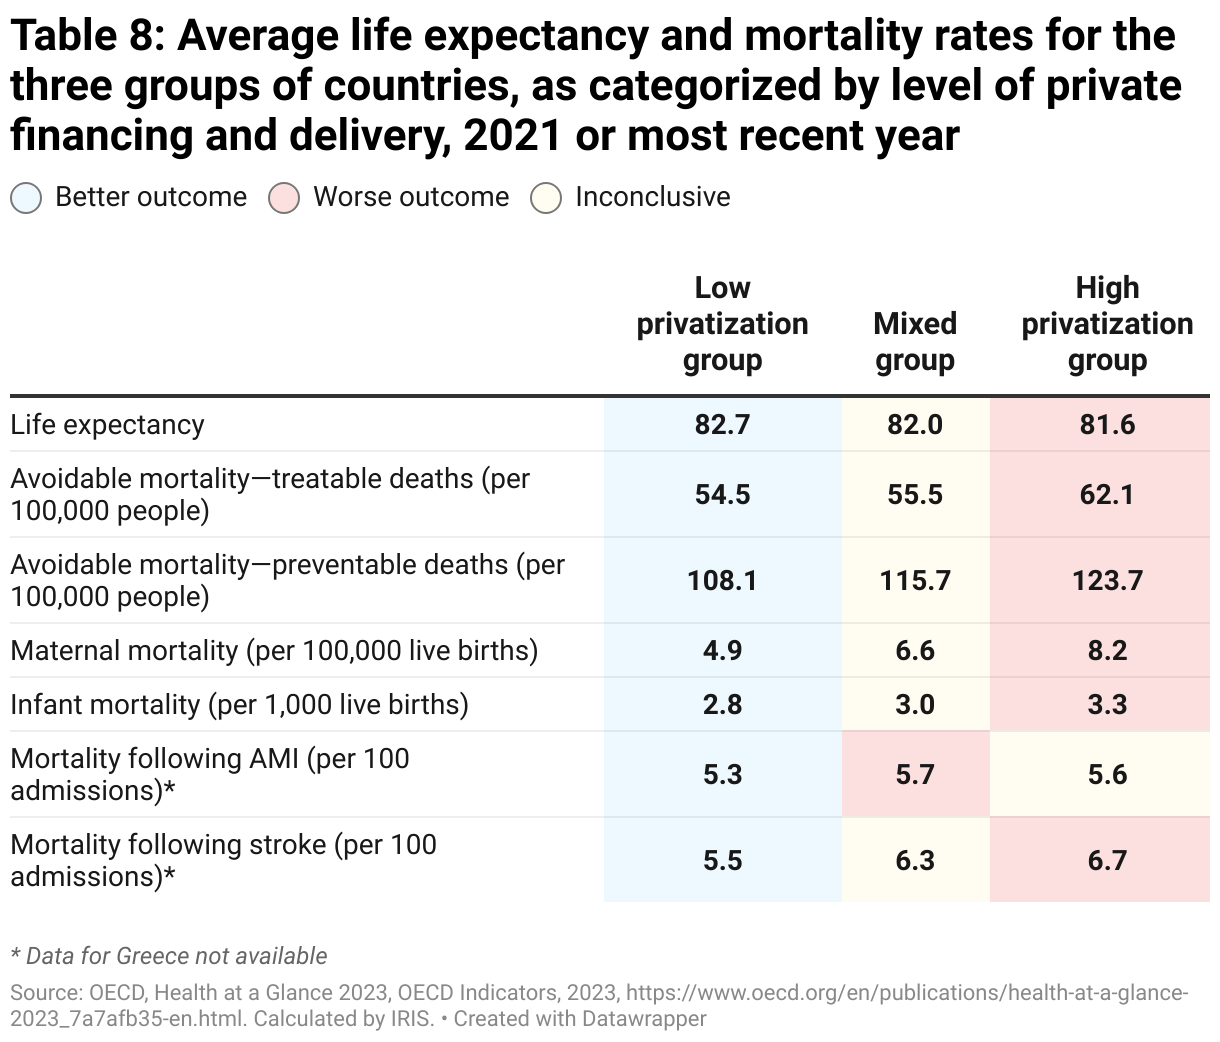
Conversely, the high privatization group has the worst outcomes across all indicators, except for mortality following a myocardial infarction (AMI), where it ranks second, just barely ahead of the mixed group in third place. The mixed group took second place for six out of the seven indicators.
For the second metric of this analysis, the percentage of countries with above-average life expectancy and mortality rates was calculated for each group. As shown in Table 9, outcomes are less starkly contrasted than the first metric might indicate.
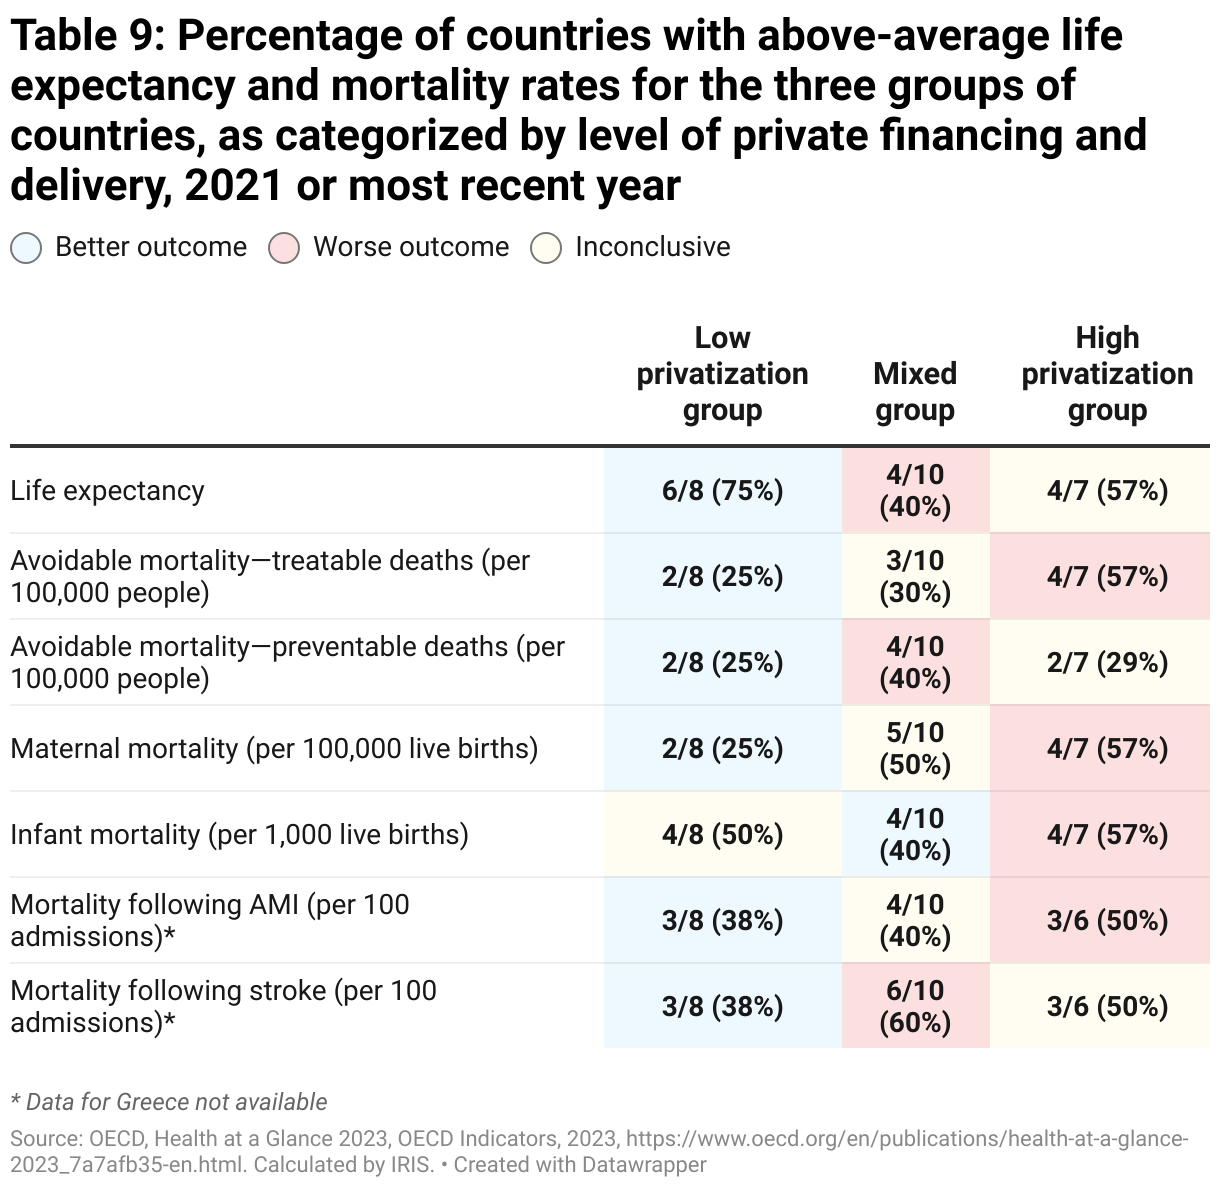
Nevertheless, as Table 9 shows, the low privatization group earned top scores on all indicator outcomes except infant mortality, where it placed second, after the mixed group. By contrast, the high privatization group did not rank first in any indicator and came in last on the majority of indicators. Lastly, the mixed group had mixed outcomes, placing it second overall: it took third place on three indicators, second place on three indicators and first place for one indicator.
Table 10 provides a summary of the two metrics presented in Tables 8 and 9. A “1” means that the group ranked first in both metrics, a “2” that it ranked second in both metrics and a “3”, last place. A “1.5” means the group earned one first place and one second place and a “2.5”, one second place and one third place.
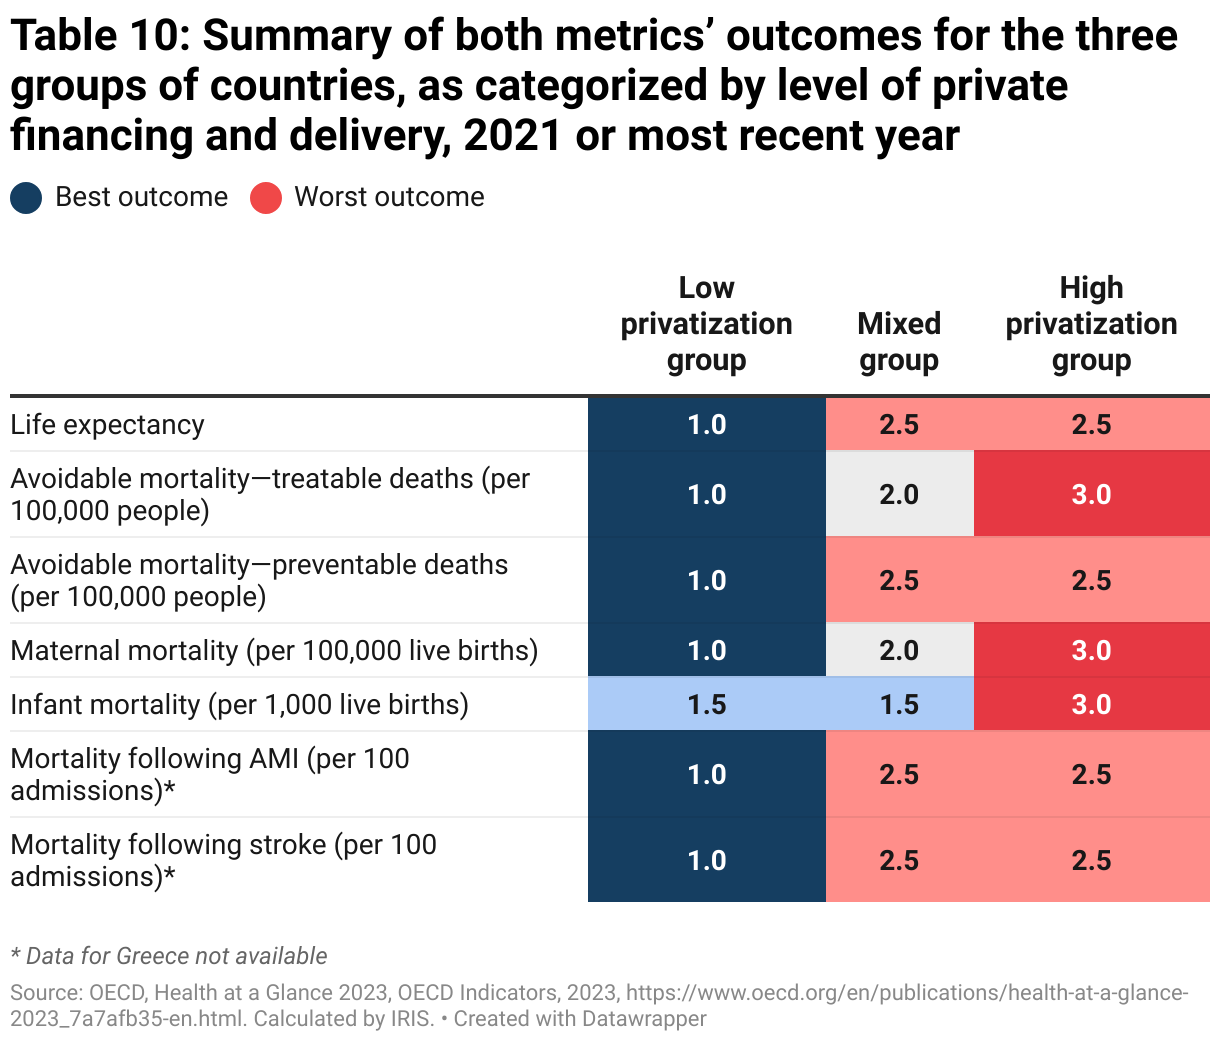
As can be clearly seen in the table, the high privatization group has worse outcomes than the low privatization group across all indicators. The mixed group’s outcomes vary greatly from one indicator to the next, but generally speaking rank somewhere between the two other groups.
Health spending, income inequality and mortality
The analysis thus far has shown a clear relationship between greater for-profit privatization in health care services financing and delivery, and lower life expectancy and higher mortality rates. However, the analysis does not confirm whether this relationship is a causal one, and other underlying factors could explain why countries with less privatization have better life expectancy and mortality outcomes.
These underlying factors include health care spending and income inequality. It is plausible to think that countries that spend more on health care are more successful than other countries at increasing life expectancy outcomes and decreasing mortality rates. In the same vein, social inequality is known to be a major factor in health: studies have shown that the greater the inequality in a country, the worse its health indicators are.18Wilkinson, Richard and Pickett, Kate, L’égalité, c’est mieux. Pourquoi les écarts de richesse ruinent nos sociétés [The Spirit Level: Why Equality is Better for Everyone], Montréal, Écosociété, 2013.
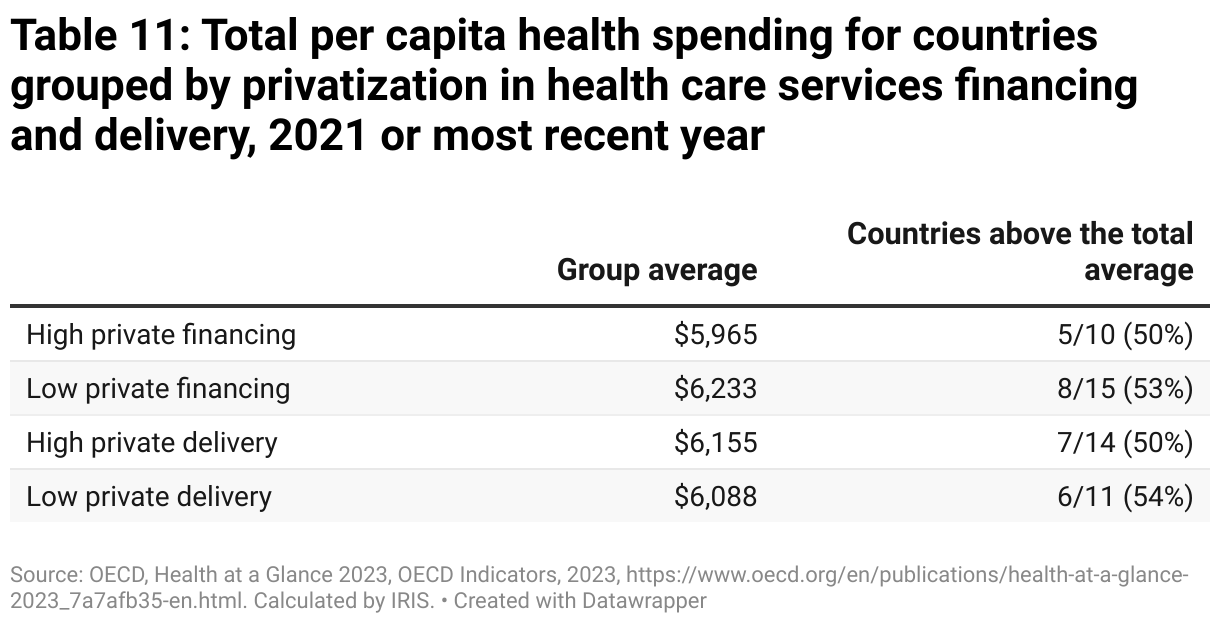
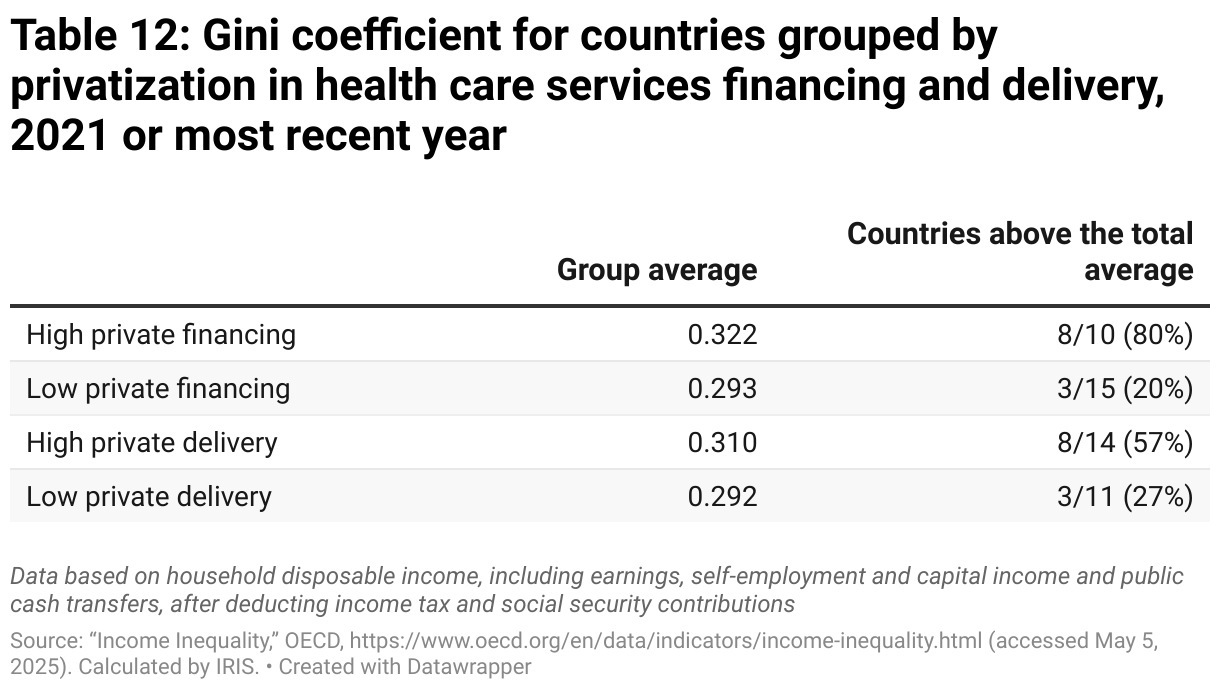
And yet, it appears that countries with less privatization of health care service financing spend more in total, on average, for health care than countries with greater privatization (Table 11). The relationship between spending and service delivery is murkier, as the two metrics give opposing results: countries with more privatized service delivery spend more on health care on average, but fewer of these countries are above the overall average. There is significantly less income inequality, as measured by the Gini coefficient,19The Gini coefficient measures income inequality within a country’s population. A score of 1 indicates complete inequality, i.e., a situation where a country’s entire income is monopolized by a single person. A score of 0 indicates complete equality, i.e., a situation where a country’s income is equally divided among the population. in less privatized countries, in terms of both financing and service delivery (Table 12).
Given how these two factors (health spending and income inequality) dovetail with the level of privatization in financing and service delivery, it is plausible to think that health spending and income inequality are the reason for the life expectancy and mortality outcomes of the different country groups, as opposed to privatization.
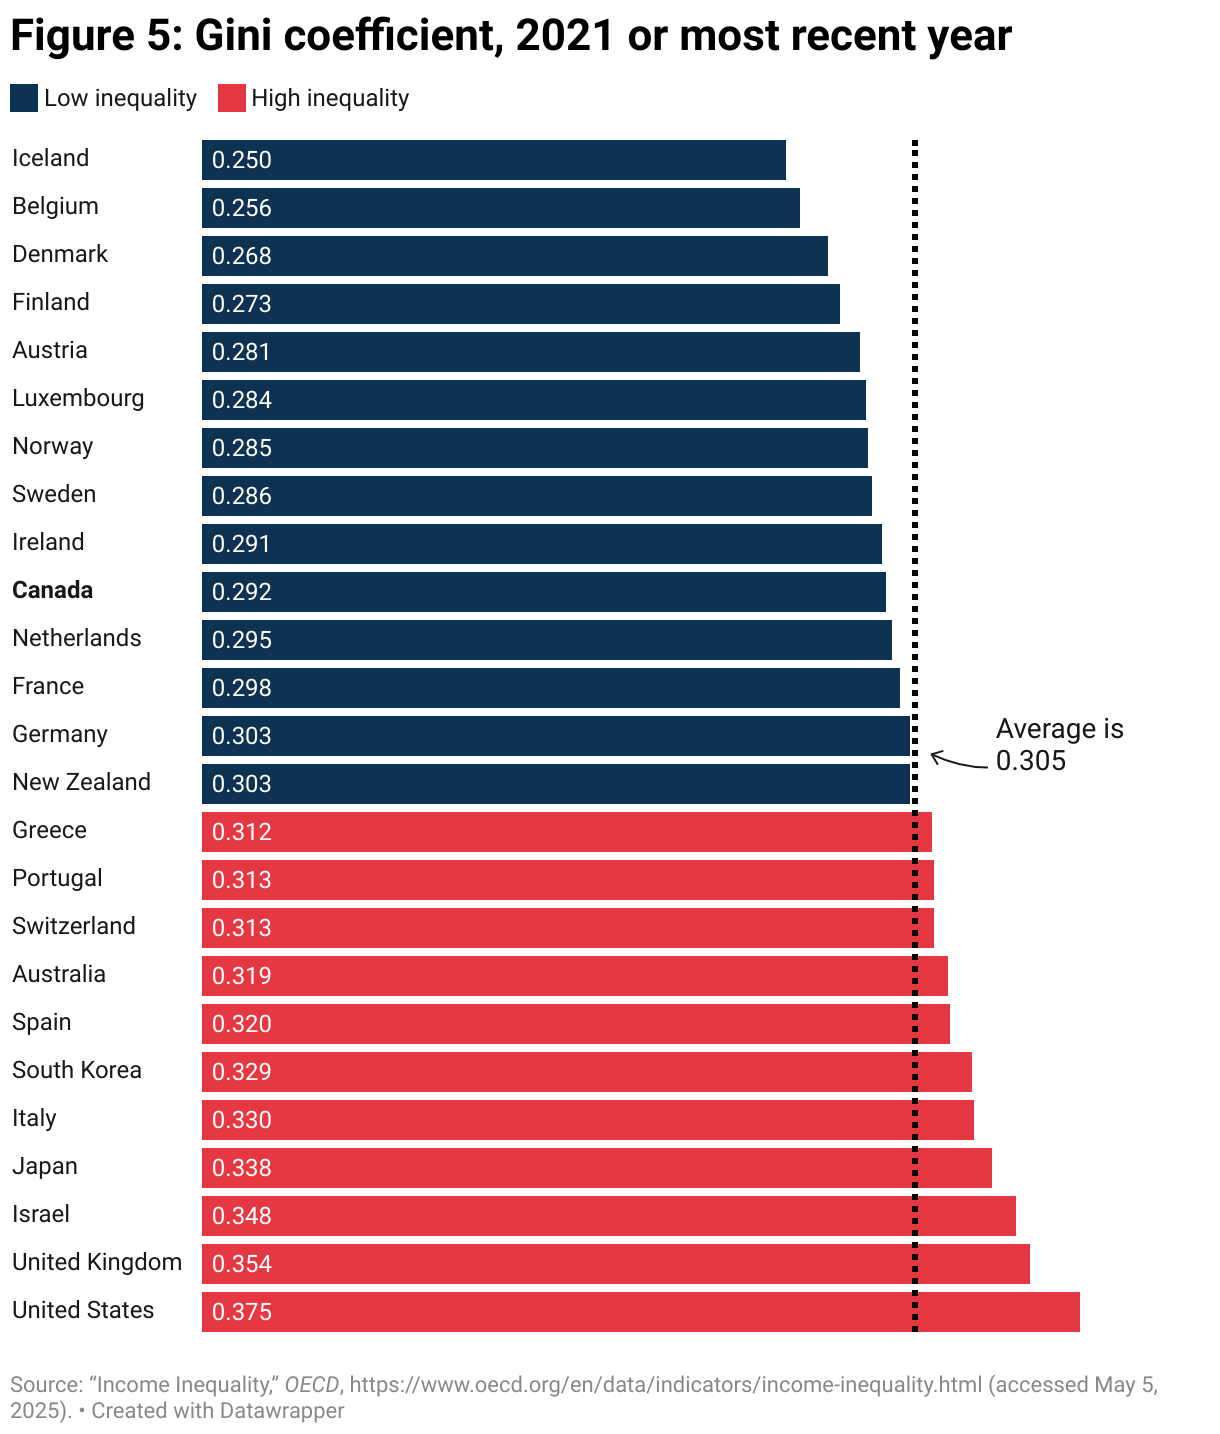
This hypothesis can be tested by redoing the analysis in the previous sections, but this time categorizing countries by health spending (Figure 4) and income inequality (Figure 5), then evaluating the life expectancy and mortality outcomes of these new country groups (Tables 13 through 16).
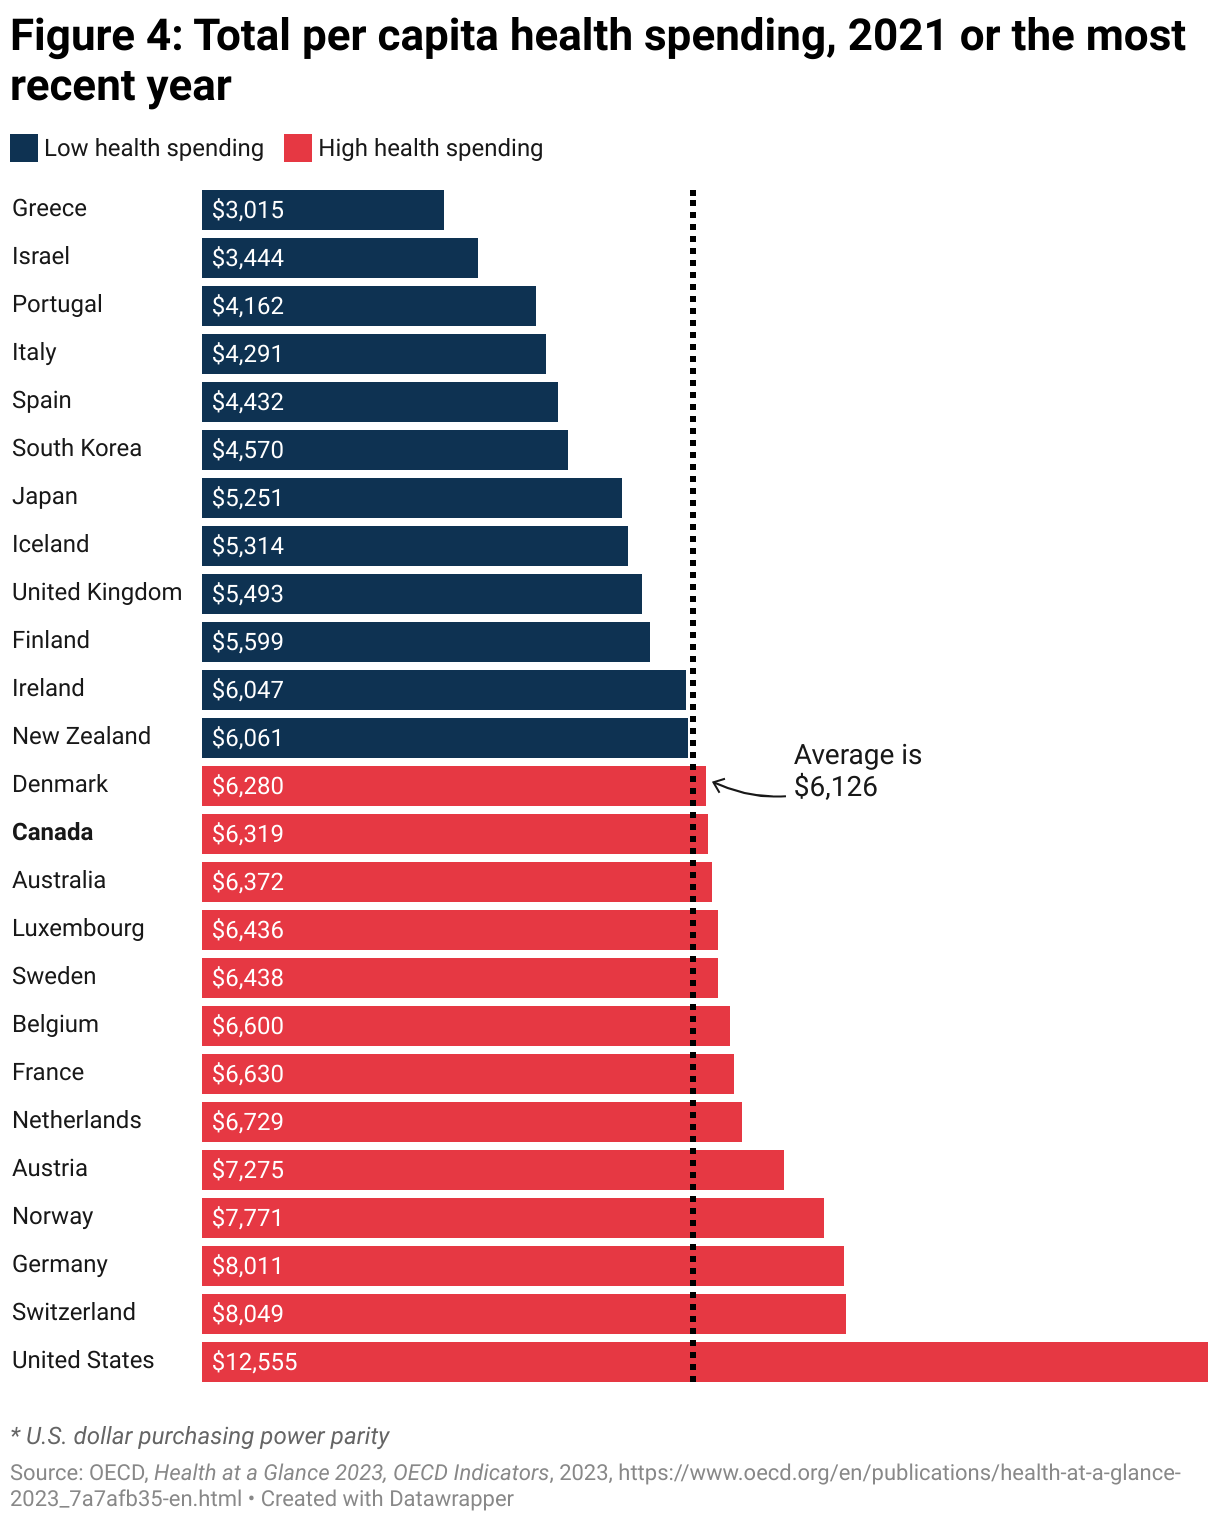
While this analysis reveals a clear link between the privatization of health care services financing and delivery and countries’ life expectancy and mortality outcomes, it did not establish the same relationship between mortality indicators and health spending, as shown by Tables 13 and 14.
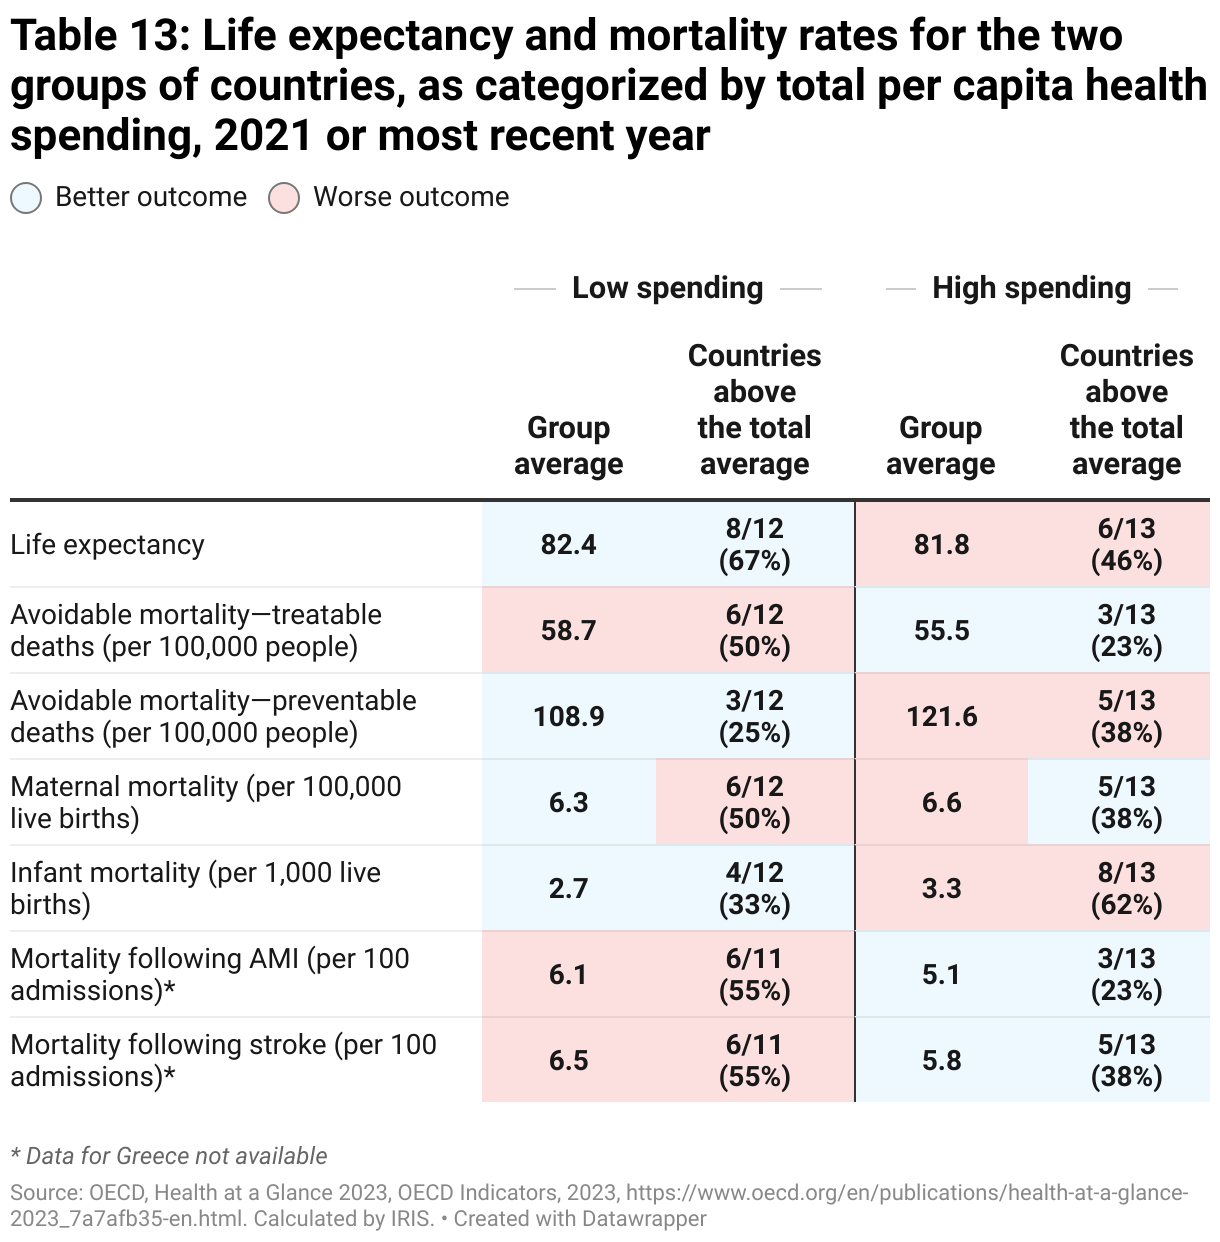
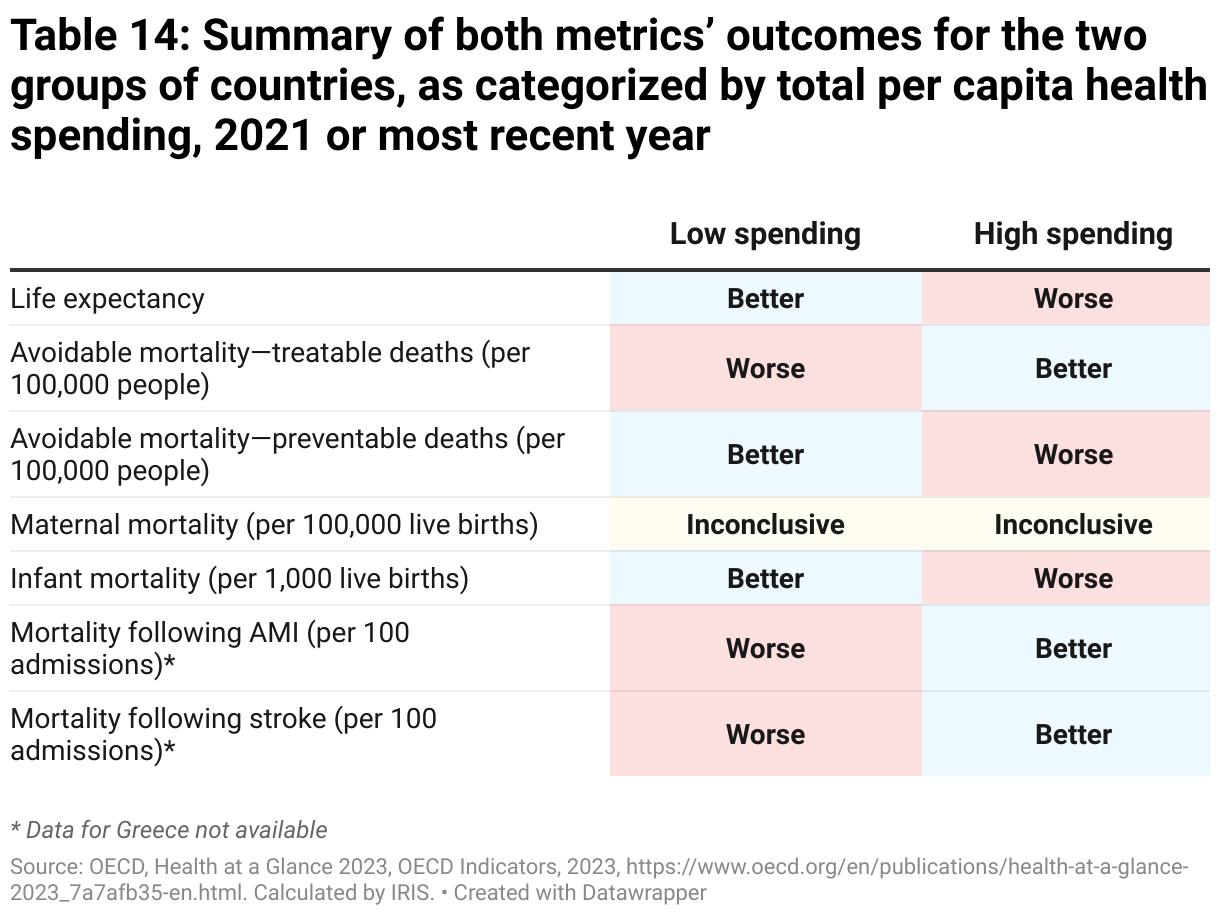
The group of countries with above-average health spending (which includes Canada) has better outcomes for three of the seven indicators used, as does the group of countries with below-average health spending. The maternal mortality indicator outcomes differ based on the metric (group average or percentage of above-average countries), making it inconclusive. In other words, health care privatization appears to play a much more decisive role than health spending in a country’s ability to improve life expectancy and decrease mortality rates.20As a reminder, the Global South and Eastern Europe, two regions where countries tend to spend less on health care, were excluded from this analysis. It is likely that the lack of a clear link between spending and mortality only holds true above a certain spending threshold.
As for income inequality, the outcomes presented in Table 15 suggest that high levels of inequality are in fact linked to higher rates of mortality, but to a lesser extent than the link established earlier between mortality and the privatization of health care services financing and delivery.
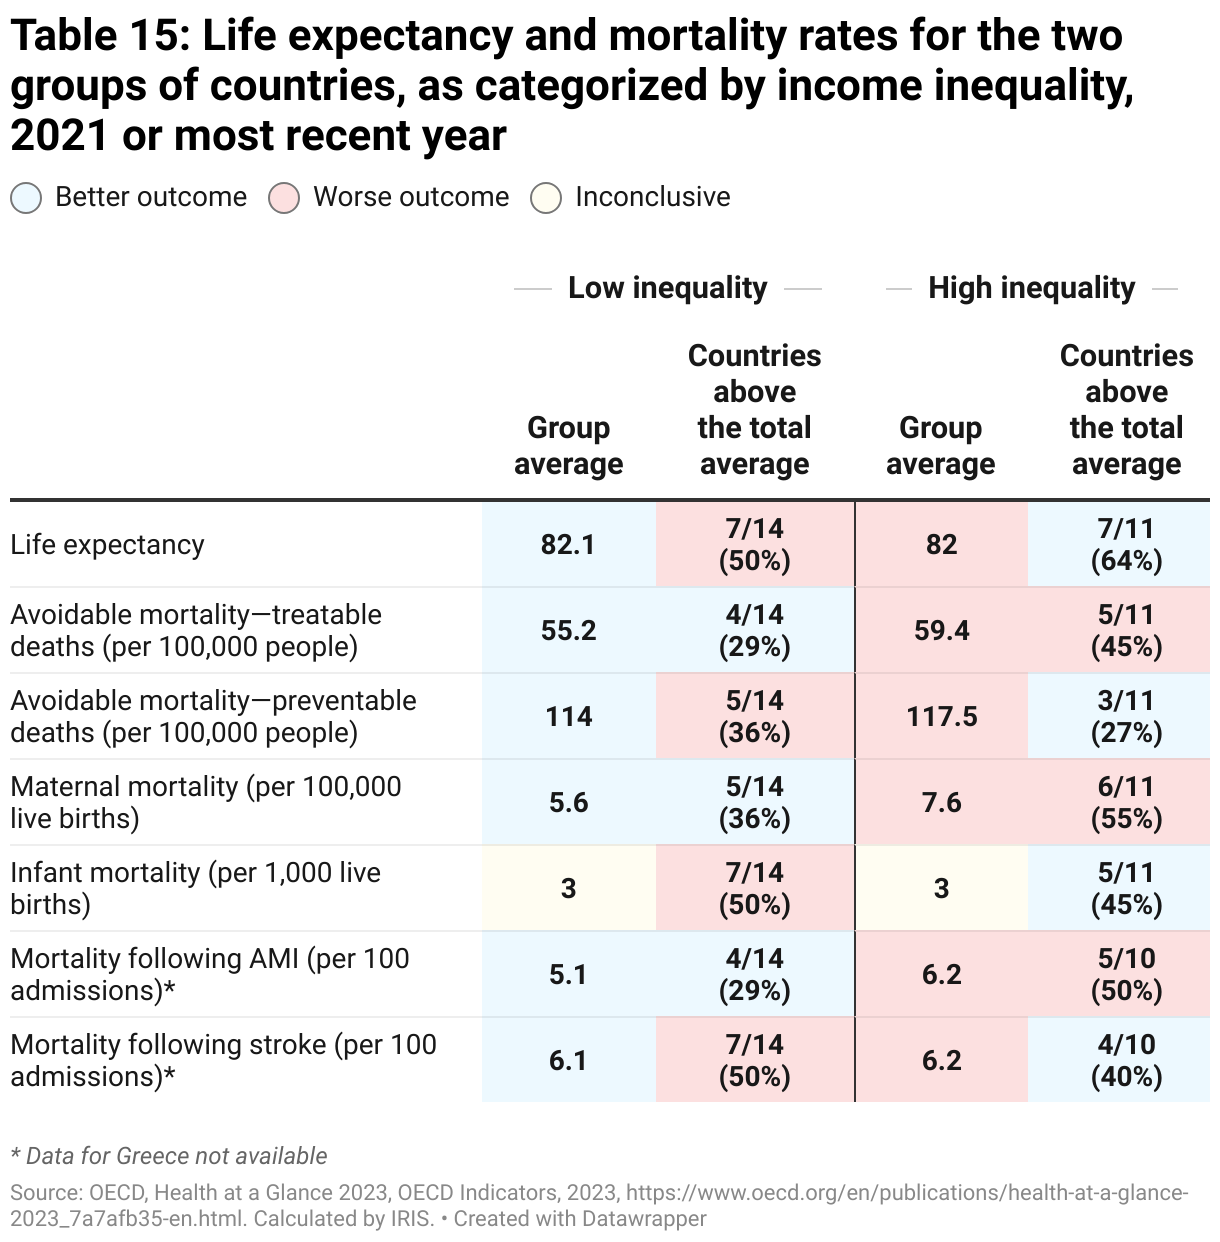
Across all indicators, the high inequality group has a lower average life expectancy and higher average rates of mortality than the low inequality group (except for the infant mortality rate, which has the same average in both groups). However, the second metric of analysis (the percentage of above-average countries for each indicator) makes the outcomes appear much less clear. The low inequality group actually has worse outcomes on the majority of indicators (four out of seven).
As a result, when both metrics are combined (Table 16), the outcomes are inconclusive for those four indicators, since outcomes differ by metric. Still, the low inequality group performs better on all indicators with conclusive outcomes.
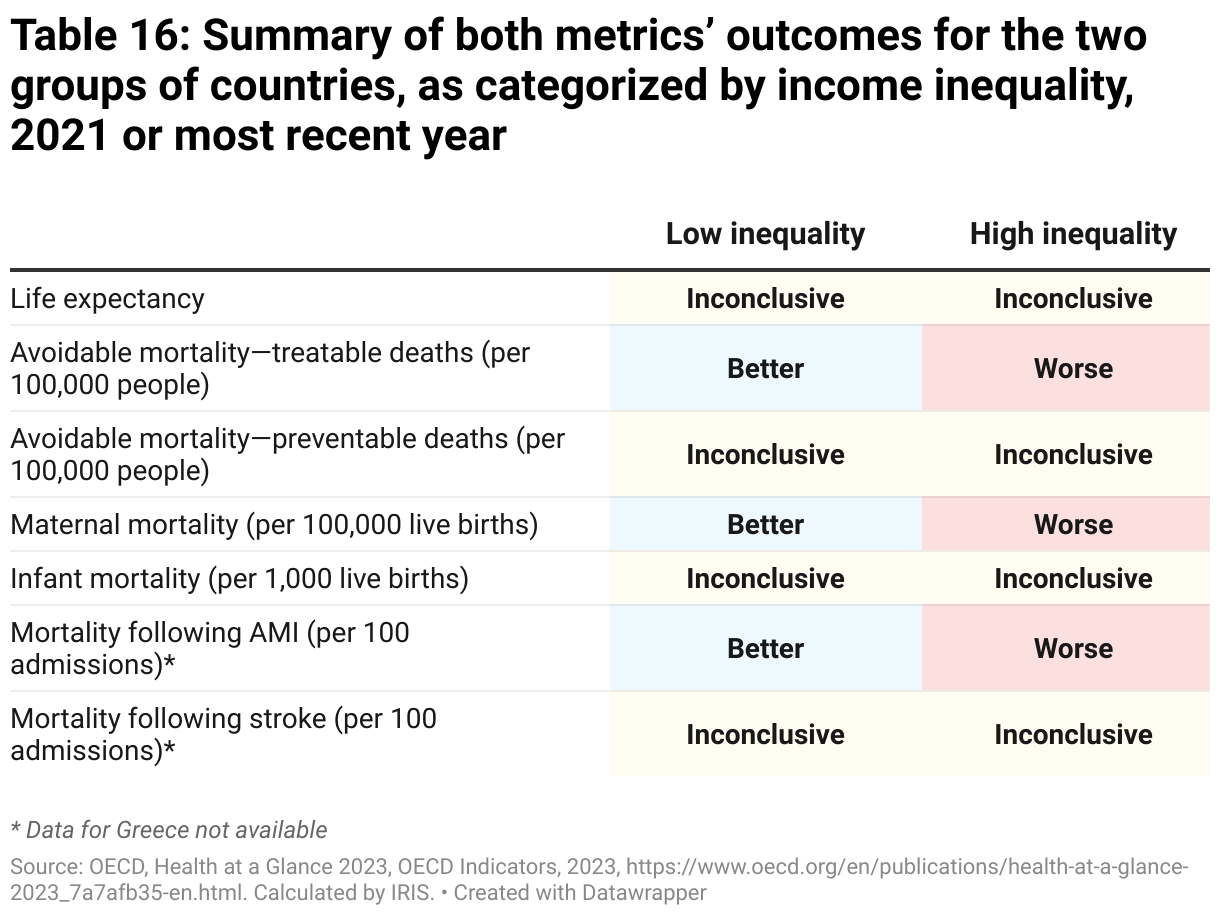
This suggests that while inequality does play a role in a country’s ability to achieve lower mortality rates, for-profit privatization in health care services financing and delivery plays an even greater role.
Conclusion: Takeaways for Canada and Quebec
In Canada, public health care systems are limited in their ability to meet the needs of users due to access-to-services challenges. Several provincial governments, including Quebec, promise to solve these issues by expanding the use of for-profit private health care service delivery. As of yet, there has been no significant public pushback to the move toward outsourcing health care to for-profit private companies, specifically because governments pledge to ensure these services are financed by the public system and are free for users.
Still, as a result of the rapid development of private virtual care during the COVID-19 pandemic, there are now loopholes that these same governments have exploited to push through greater privatization of health care services financing, all without informing the public and debating the risks posed by privatization to health care access and quality.21For more on loopholes created by private virtual care: Plourde, Anne, L’industrie des soins virtuels au Québec [The virtual care industry in Quebec], socio-economic brief, IRIS, January 2023, https://iris-recherche.qc.ca/publications/soins-virtuels/; Plourde, Anne, “Télémédecine : la porte grande ouverte à l’industrie privée” [Telehealth: Doors open wide to the private industry], La Presse, January 18, 2023, https://www.lapresse.ca/debats/opinions/2023-01-18/telemedecine/la-porte-grande-ouverte-a-l-industrie-privee.php.
As shown by this study’s analysis using data from 25 OECD countries, it would be a mistake for Canada and Quebec to continue down the path of privatization. The data shows a clear link between greater for-profit privatization in health care, and lower life expectancy and higher mortality rates. The international comparisons in this research brief show this relationship holds true not only for private financing, but also for private delivery (perhaps even more so).
However, as evidenced by Table 17, Canada already has rather mediocre life expectancy and mortality outcomes when compared with the other OECD countries in this analysis. Despite higher-than-average total health spending and lower income inequality, Canada only performs better than average on two out of the seven mortality indicators under review. Canada also sticks out for having a maternal mortality rate that’s nearly double the average, and an infant mortality rate that’s 50 per cent higher than average.
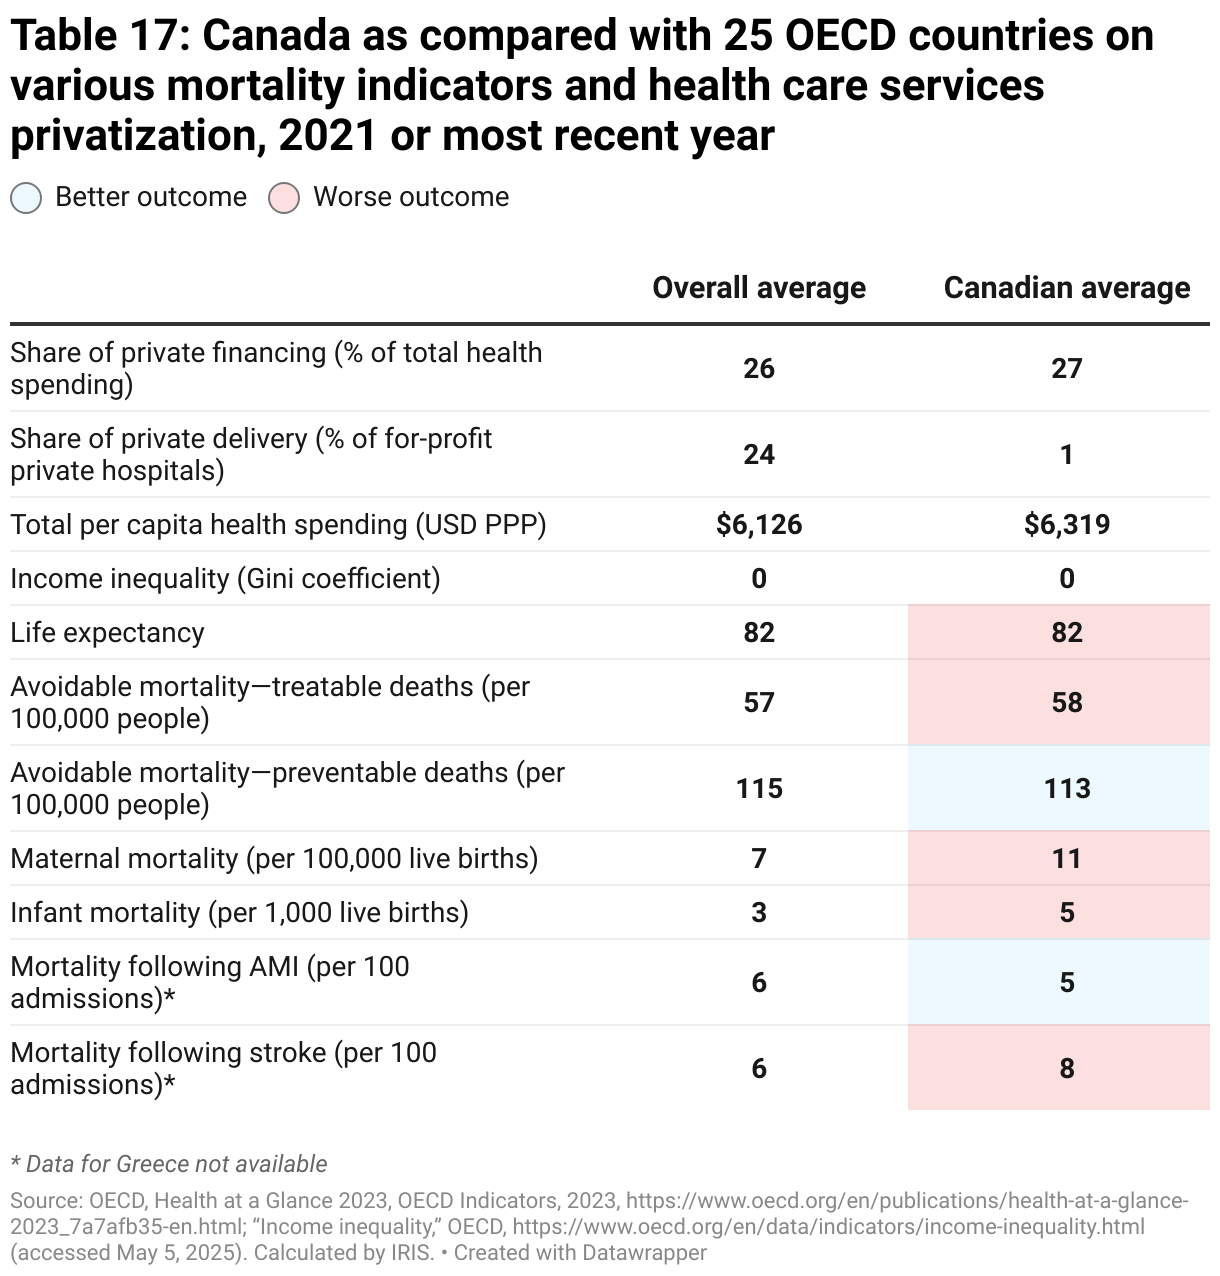
These lackluster outcomes were produced by a Canadian health care system that has already allowed for greater privatization of service financing, but has greatly limited—for now—the privatization of service delivery, at least for hospitals.22While hospital privatization is virtually non-existent, with barely 1% of hospitals being for-profit private hospitals, there is significant privatization in the delivery of front-line medical services, as they are almost entirely offered by physician entrepreneurs practicing out of private clinics. These services are, however, covered by the public health care plan. There are, of course, several factors that could explain Canada’s lower life expectancy and higher mortality rates. Regardless, it must be concluded from this study’s analysis that when governments choose to increase private financing and private delivery of health care services, they run the risk of making health care worse for the public, not better.