Find where your community fits with our interactive map of child care deserts across Canada in 2025
Summary
Since 2021, the federal government has been funding a rollout of a Canada-wide $10-a-day child care program. One of the more public goals is to reduce child care fees to $10 a day by April 2026. However, a less public goal is a major expansion of spaces.
To track trends, the Canadian Centre for Policy Alternatives (CCPA) has created a proprietary database named the Childcare Licensing and Accessibility by Region (CLAR) database. It individually tracks all 1.32 million licensed child care space in any province. It also calculates the accessibility of child care for all 53,861 city blocks in any province (Dissemination Area). From the CLAR database, we track changes from the fourth quarter of 2022 to the first quarter of 2025. Among the key findings:
Growth in child care spaces, but mixed levels of progress
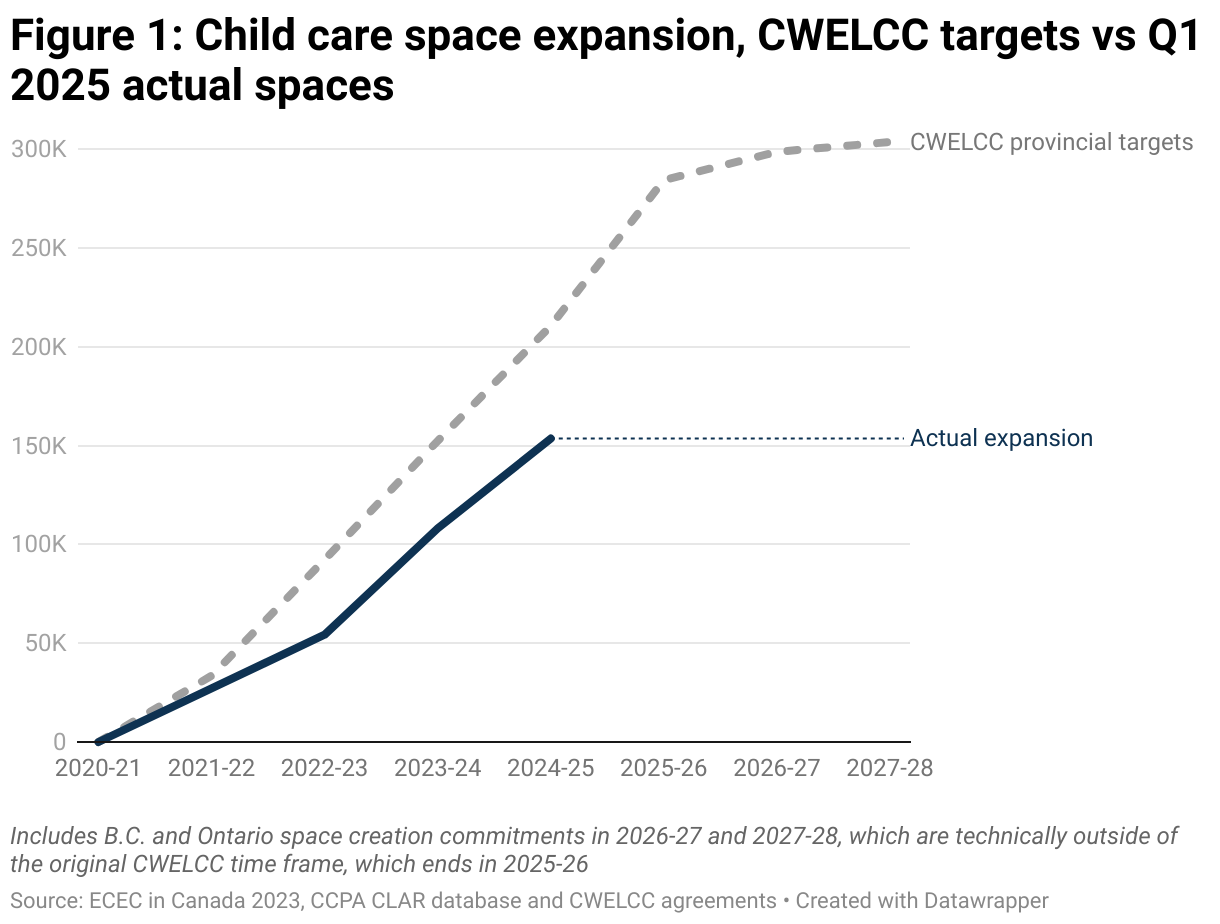
By April 2025, the provinces promised to create 210,604 new full-time spaces with federal money, but they are short 57,030 spaces.
- New Brunswick has created 47 per cent more spaces than it committed to and it has already surpassed its space creation goal for 2025-26.
- British Columbia has created more than 25,000 new spaces, exceeding its April 2025 goal of just over 20,000 new spaces. The province is well positioned to hit its goal of just over 30,000 new spaces for 2025-26 and 40,000 new spaces by the end of 2027-28.
- Ontario and P.E.I. are close to meeting their April 2025 targets and are well on their way to hitting their final 2025-26 space creation goals.
- Most of the other provinces are lagging in terms of space creation. Manitoba and Saskatchewan have only created a fraction of the promised spaces. While there has been space creation in both provinces, they are nowhere near the scale so far to meet the target.
Who will hit the federal target of 5.9 full-time spaces for every 10 children?
Whether raw space creation goals are hit or not isn’t the real battle, it’s whether parents can find a space. To evaluate that, we need to look at how many spaces there are per 10 children. If they hit their raw space creation targets, and this is a big if, this would be the result:
- Quebec and P.E.I. are already at or above the federal target of 5.9 spaces per 10 children.
- Saskatchewan, Newfoundland and Labrador and Nova Scotia would get to roughly 5.9 spaces per 10 children. Unfortunately, none of these provinces is on pace.
- Manitoba and British Columbia will be slightly below 5.9 spaces per 10 children if they create their promised spaces. Unfortunately, Manitoba is nowhere near where it should be in 2025.
- Alberta, Ontario and New Brunswick might hit their raw space creation targets. But even if they did create what they promised, their coverage rates would be below 5.9 spaces per 10 children.
For-profit providers are taking advantage of this publicly funded program
An important stipulation of the child care agreements is that the spaces created should be primarily non-profit or government run. The costs of the child care system in most provinces and territories are now being paid almost entirely from the public purse. For-profit providers are cashing in:
- Since 2022, 57 per cent of all the net new licensed child care spaces for non-school age children have been for-profit spaces—larger for-profit chains make up a quarter of the growth.
- Only 30 per cent were public or non-profit, and the remainder were new homes.
- This hasn’t been a Canada-wide public expansion of child care—it has been an overwhelmingly for-profit expansion.
Child care deserts remain
The federal goal is 5.9 spaces per 10 children. But many children live on a city block with fewer than three spaces per 10 children nearby (net of the overlapping needs of other children), which constitutes a child care desert.
- British Columbia cut its rate from 38 per cent of children in a child care desert in 2022 to 16 per cent in April 2025, a drop of almost a quarter.
- Alberta, Saskatchewan, Newfoundland and Labrador and Ontario reduced the proportion of their children living in child care deserts by roughly 15 percentage points.
- Saskatchewan still has the largest proportion of its child population living in child care deserts, at 51 per cent, but the situation has improved from where it started in 2022, at 70 per cent.
- P.E.I., Quebec, Nova Scotia and New Brunswick have managed to increase the proportion of their children living at or above the federal target by roughly 10 percentage points.
- Child care deserts are clearly related to population density, being lowest in big cities and highest in rural areas. However, rural areas of Quebec have fewer deserts than major western cities like Calgary or Winnipeg.
- Child care deserts are not consistently related to parental income. In some provinces, the richest city blocks do have the best access, but in others the poorest blocks win out.
Child care accessibility in 45 Canadian cities
- Kitchener, Oshawa and Fort McMurray have three quarters of their children living in child care deserts, with little licensed child care nearby, adjusting for the needs of other blocks of children.
- While half of the children in Calgary live in child care deserts, there is a surprising minority of 17 per cent of children who enjoy the federal target of 5.9 nearby spaces per 10 kids. This illustrates how unequal the distribution of child care deserts can be.
- At the other end of the spectrum, many Quebec cities and Charlottetown have almost no children living in child care deserts and almost all blocks meet federal targets of at least 5.9 spaces per 10 children.
- Some cities—like Vaughan, Coquitlam, Burnaby and Oakville—buck their provincial trend and have almost none of their children living in child care deserts, although most of the children have inadequate coverage, with between three and 5.89 licensed spaces per 10 kids.
Next challenge
As very high market fees become a thing of the past, policy-makers now need to shift their focus to the next challenge: rapid space creation—and keep those spaces in public, non-profit hands.
What’s needed now is strong public planning. The non-profit or public providers who will expand must be identified by government and they must be provided with the tools to expand. Otherwise, we will end up with a larger private system expanded in places where it’s convenient for providers, not to where children live.
Introduction
The 2021 federal budget announced a sea change in the treatment of child care in Canada with the introduction of the Canada-wide Early Learning and Child Care (CWELCC) system. It took a pandemic to illustrate the critical nature of child care to the basic functioning of the Canadian economy. When you don’t have it, parents can’t work. Not only did the pandemic illustrate the impact of the loss of child care, it also illustrated the potential for a more expansive version of child care. While this had long been known by advocates, it was the pandemic that allowed the benefits of child care to break through the political consciousness of everyday Canadians.
The first and most visible initial goals of the CWELCC involved lowering child care fees. High fees were widely known to be a major barrier to parents, restricting their ability to use child care in most jurisdictions. The first goal is that each jurisdiction reduces their fees by 50 per cent by December 2022 and then to an average of $10 a day by April 2026. The success of these goals has been written about extensively elsewhere.1David Macdonald and Martha Friendly, Measuring Matters: Assessing Canada’s progress toward $10-a-day child care for all, Canadian Centre for Policy Alternatives, October 2023. 2David Macdonald and Martha Friendly, From Market to Managed: The uneven path to $10 a day child care, Canadian Centre for Policy Alternatives, July 2025. Broadly speaking, fees are falling rapidly in Canada as most provinces and territories have switched to directly setting maximum fees. Despite the progress, several provinces still have further to go to reach $10 a day, but there is a year left to get there.
As very high market fees become a thing of the past, policy-makers now need to shift their focus to the next challenge: space creation. Lower fees mean many more parents want to use child care (which is the point), but they face lengthy wait lists, which threaten to get even longer unless governments invest in a huge boom in licensed space creation. Assumptions around massive growth in spaces also underpin the economic benefits of the CWELCC plan including stronger economic growth, more female labour force participation and higher tax revenues.
These challenges were not lost in the negotiation of the initial CWELCC agreements. Those agreements commit to the specific numbers of new spaces each province or territory is expected to create and over what time frame. The priority for the type of spaces to be created is also clear: they should be public or non-profit.
Now that we are several years into those agreements, it’s possible to evaluate how the provinces are progressing towards their goals, whether they are good goals and how child care accessibility has changed under CWELCC.
Space tracking in our new database
To that end, the Canadian Centre for Policy Alternatives (CCPA) has created a proprietary child care licensing database named the Childcare Licensing and Accessibility by Region (CLAR) database. This database tracks every single licensed child care space in any province, whether in a home or centre. Unfortunately, due to data constraints, a similar tracking system isn’t possible for the territories. CLAR tracks the license type, who owns the facility, where it’s located, and the children that live nearby. We’ll be updating this database over time to track the growth of licensed child care; we’re also keeping it current so data isn’t years out of date. Unless otherwise specified, the most recent data presented in this paper is as of March 31, 2025. Generally speaking, we are comparing the first quarter of 2025 to our first data snapshot from the fourth quarter of 2022.
At present, we’re tracking 1.32 million licensed child care spaces in all the provinces. These are contained in 19,976 licensed homes and 23,692 centres. Of those spaces, 94 per cent are located in centres and six per cent are located in licensed homes. Those centres are owned/operated by 11,496 entities (for-profit, non-profit and public). Our database is actively tracking openings, closing, expansions and contractions of licensed facilities.
As far as we know, this is the largest effort in the country, inside or outside government, to collect, systematize and regularly evaluate one of the largest expansions of public funding under way. Our goal is to report the conclusions to inform policy-makers, activists and parents on the CWELCC rollout and what course corrections will be needed along the way.
For more details on the creation of the CLAR database, its sources, its age categories and its limitations, see the methodology section.
Our CLAR database tracks licensed spaces based on provincial registries. Any net change in spaces is the result of a change in a license, not a government promise to create spaces. However, licensed capacity is different from operational capacity or occupancy. Just because a facility has a license for a space doesn’t mean there is a child in that space. Facilities may encounter difficulties finding and retaining staff, they may leave spaces vacant to accommodate children aging into spaces, new facilities may not be entirely up and running or there may be other reasons why they aren’t full to their licensed capacity. As such, the figures from our CLAR database and in this report represent the “best case scenario” if every licensed space is occupied, which isn’t always the case.
In this report, we’re excluding before- and after-school spaces and only focusing on children who aren’t yet in public school and aren’t using before- and after-school spaces. We’re calling them non-school age children and non-school age spaces. There is a tendency to call these spaces and children preschool, but this term has different technical meanings depending on the province. In Ontario, it means children from age three to school age, but in BC, it means before- and after-school care. To avoid confusion, in this report we’re using the term non-school age spaces and children.
School entrance ages differ by province and those different entrance requirements are taken into account.
Most non-school age spaces are full time, but where part-time space statistics are also available, they are pro-rated to full-time spaces (two part-time spaces makes a full-time space). Some facilities offer extended day child care, say overnight or up to 15 hours. These are difficult to identify and so no prorating is possible.
When we compare spaces to child populations, we’re limiting those populations to children not yet in public school—those not yet eligible for junior kindergarten or kindergarten in their province. Some provinces (notably Saskatchewan, Manitoba and Alberta) have only part-day kindergarten. Therefore, the first year of school-age child care is effectively full time for many. However, those full-time, school-age child care spaces are still excluded.
The CWELCC agreements specify children aged from birth to five years old should be included, however, most child care licensing systems don’t work on such a strict age basis. Instead, license definitions separate care by ages below school age, with school age being a key licensing variable. Entrance into public school is used as the key threshold for which licensed spaces and which children are counted, unless otherwise stated.
See the methodology for more details on provincial specific age-inclusion calculations.
CWELCC space creation targets: hard numbers and coverage rates
The federal-provincial CWELCC agreements have specific full-time space creation targets. However, those targets are spread over varying timelines and often use hedge words, like “up to xxx spaces”. For the purposes of the analysis below, we’ve standardized the timelines and assumed that all “up to” goals are met in full.
In the original CWELCC agreements, the combined provincial target meant the creation of almost 250,000 new spaces by 2025-26. However, with several more recent estimates, the promised expansion by 2025-26 is now 284,000 spaces. If we move the time frame to 2027-28, the goal is just over 300,000, since Ontario and British Columbia have promised additional spaces beyond the initial 2025-26 CWELCC end date.3See Employment and Social Development Canada, “Toward $10-a-day: An Early Learning and Child Care Backgrounder,” section “Increased access for families”, March 2025, https://www.canada.ca/en/employment-social-development/news/2025/03/toward-10-a-day-an-early-learning-and-child-care-backgrounder0.html.
Using our CLAR database, we’re able to follow progress towards the provincial goals. As of the first quarter of 2025, we’ve tracked the net new licensing of 153,574 non-school age, full-time equivalent spaces. Figure 1 charts the actual net licensing change against where the provinces promised to be at this point. For comparison, the provinces should have created 211,000 new full-time spaces by the end of 2024-25—so they are short 57,030 spaces as of the end of the first quarter of 2025, but they are trending in the right direction.
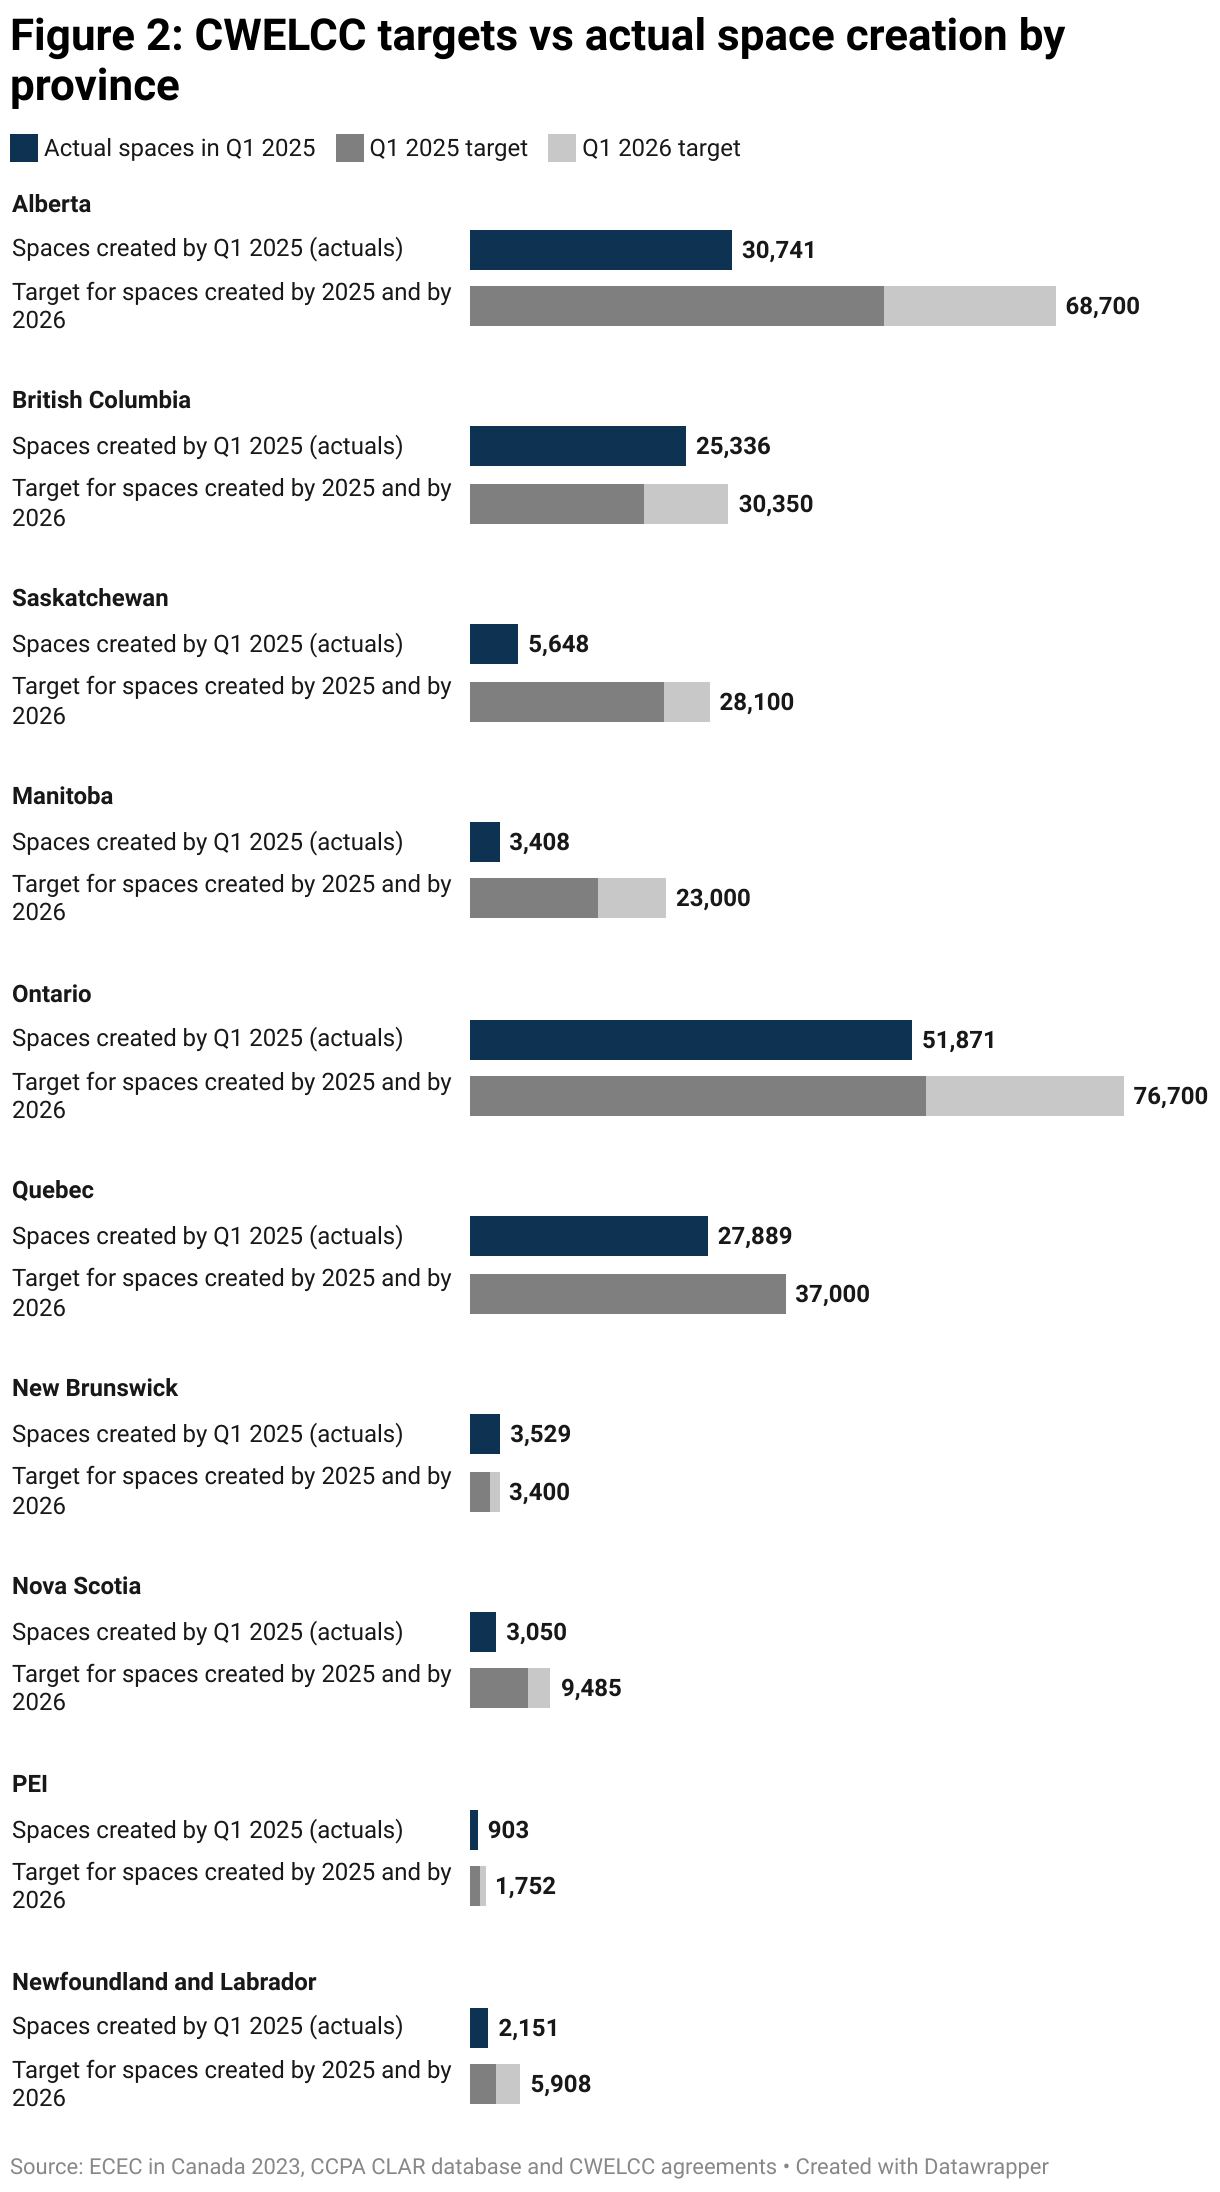
We can further break down how close provinces are to hitting their targets as of the end of the 2024-25 fiscal year, or quarter one of 2025. Figure 2 outlines where provinces should be by the first quarter of 2025, given their CWELCC agreements. Using the CLAR database, we can evaluate how they’re doing compared to those goals. As suggested by Figure 1, most provinces are struggling to hit their CWELCC targets. All provinces, except Quebec, have even higher space creation goals by the end of 2026, which are the additional bars on top in Figure 3. To hit the 2025-26 CWELCC targets, provinces will have to make up any shortfall to date and then continue to expand.
To start on the positive side, several provinces have exceeded their CWELCC targets for space creation and seem well positioned to hit their full 2025-26 CWELCC commitments. New Brunswick has created 47 per cent more spaces than it committed to in the CWELCC agreements for the first quarter of 2025. In fact, by the first quarter of 2025, the province had already surpassed its space creation goal for the entire period through the end of 2025-26. British Columbia’s space creation has been proceeding apace, with over 25,000 new spaces created by the first quarter of 2025, this exceeded its goal of having just over 20,000 new spaces by that time. The province is well positioned to hit its goal of just over 30,000 new spaces by the end of 2025-26. B.C. has also promised some additional space creation, not shown in Figure 2, to reach 40,000 new spaces by the end of 2027-28.
Ontario and P.E.I. are quite close to meeting their first quarter of 2025 targets and are well on their way to hitting their final 2025-26 space creation goals.
Most of the other provinces are lagging in terms of space creation. Manitoba and Saskatchewan have only created a fraction of the promised spaces. Both provinces promised ambitious expansions in the CWELCC agreements. If they deliver, they will double the number of spaces in Manitoba and nearly triple them in Saskatchewan. While there has been space creation in both provinces, they are nowhere near the scale so far to meet those ambitious goals.
While the creation of 250,000 or 300,000 new child care spaces may sound impressive, those large numbers can’t be evaluated without comparing them to the need. In other words, is this enough to ensure parents can find a space without being on waiting lists for years?
To ensure adequate access, the raw space count needs to be compared to the number of children. Here, we move from large raw numbers to coverage rates or a target for the number of spaces per child who might be trying to access those spaces. The coverage rate can be expressed as a percentage, but it may be easier to understand it as a count of licensed spaces per 10 children.
In the context of public schools, for example, you want almost 10 desks per 10 children of school age. All children of school age are entitled and required to be in school. The number of desks per 10 children would be slightly less than 10 due to very small numbers in home schools and private schools.
For child care, one would likely plan for fewer than 10 licensed spaces for every 10 non-school age children. Parents often stay home for part or all of the first year of a child’s life. Some parents don’t work and will care for young children on their own and there is no legal requirement that a child goes to child care, whereas children are legally required to attend public school. Nonetheless, a coverage rate is a much better gauge of access than a context-free number, like 250,000 new spaces, which may or may not be enough to ensure access.
While not universal, eight of the CWELCC agreements have a coverage rate target.4These include Nova Scotia, Yukon, Saskatchewan, P.E.I., Nunavut, the Northwest Territories, Newfoundland and Labrador, and New Brunswick. All of them have the same target of 59 per cent, or 5.9 full-time licensed spaces for every 10 children under age six. B.C., Alberta, Manitoba and Ontario didn’t agree to a specific coverage rate target, but they did agree to specific counts of new licensed spaces. Quebec committed to creating 37,000 new reduced contribution spaces, but didn’t agree to a coverage rate target.5Government of Quebec, Government of Canada, 2021 to 2026 Asymmetrical Agreement on the Canada-Wide Early Learning and Child Care Component, July 2021, https://www.canada.ca/en/early-learning-child-care-agreement/agreements-provinces-territories/quebec-canada-wide-2021.html. 6Government of Quebec, Government of Canada, Implementation Agreement 2021-2025 of the March 10, 2017, Asymmetrical Agreement—Early Learning and Child Care Component, https://www.canada.ca/en/early-learning-child-care-agreement/agreements-provinces-territories/quebec-2021.html.
The origin of such a specific target as 59 per cent is unclear, although it may be related to the coverage rate in Quebec. What is clear is how consistent it is as a sort of interim federal target. Through this report, we’ll use the 59 per cent, or 5.9 spaces per 10 children, as the interim federal coverage rate target for full-time licensed spaces, even though not all provinces agreed to it.
It’s worth pointing out that a target child care coverage rate of 59 per cent is relatively low and likely won’t eliminate parent frustration about the difficulty finding a spot, but it would be a good start and is certainly a reasonable short-term goal. The European Union’s (EU) updated Barcelona targets for 2030 specify a coverage rate of 45 per cent for children under three and 96 per cent for children between three and school age.7Council of the European Union, Council Recommendation of 8 December 2022 on Early Childhood Education and Care: the Barcelona targets for 2030 (2022/C 484/01), Official Journal of the European Union, C 484, 20 December 2022, https://eur-lex.europa.eu/legal-content/EN/TXT/HTML/?from=EN&uri=OJ%3AC%3A2022%3A484%3AFULL#:~:text=TARGETS%20ON%20EARLY%20CHILDHOOD%20EDUCATION%20AND%20CARE. Based on 2025 child population estimates in Canada, this would result in a weighted coverage rate of 67 per cent for non-school age children. This is well above the 59 per cent embedded in the CWELCC agreements. The EU’s Barcelona targets could make for a logical next step in child care expansion in Canada, with the 59 per cent target being a step along the way.
As we’ll see in Figure 3, even if the provinces hit their CWELCC targeted space creation goals, in several cases, this will leave coverage rates well below 5.9 spaces per 10 kids. Inadequate coverage will result in parents not finding spaces, creating a serious political problem as a result. Parents’ experience in finding spaces will counter any positive political message about a certain number of spaces having been successfully created.
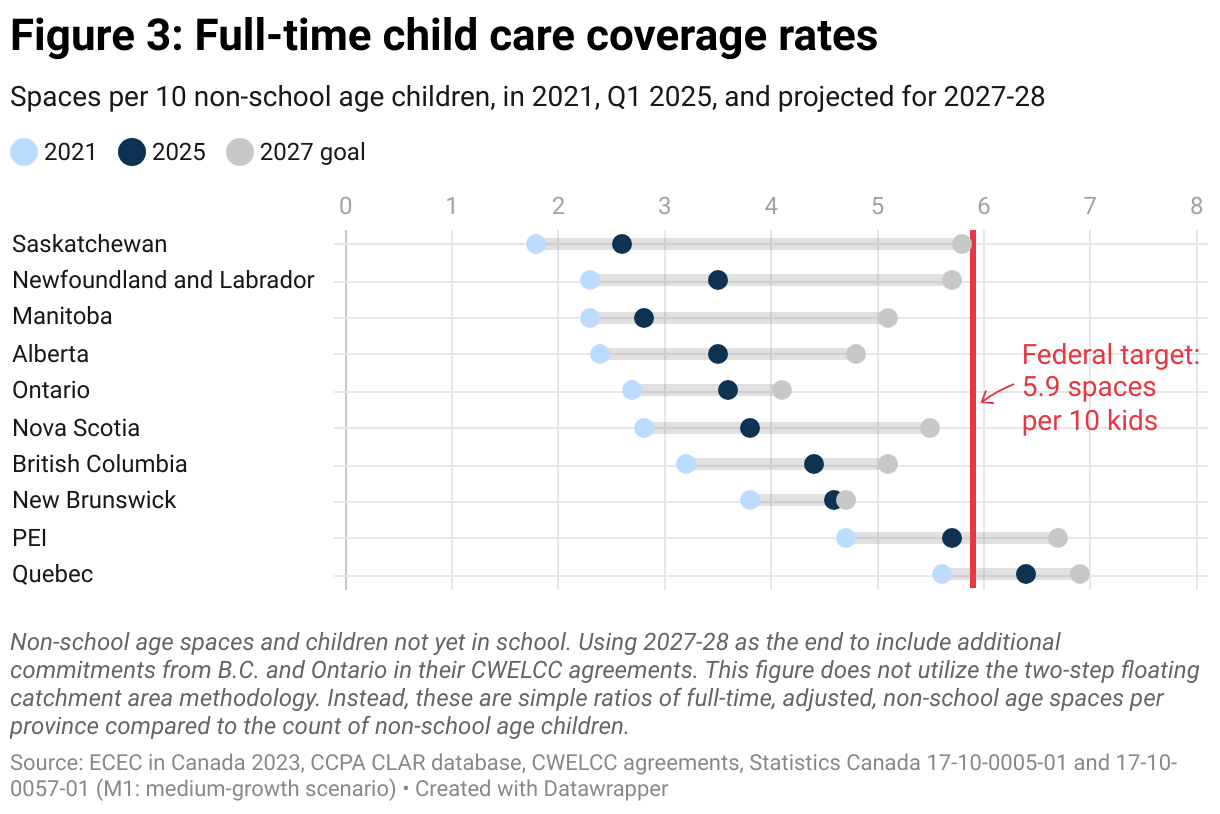
Figure 3 shows where each province started from in 2021 (bottom of line), where they are in the first quarter of 2025 and where they’ll be in 2027-28 if they hit their CWELCC space creation targets. The first round of CWELCC space creation targets ends in 2025-26, but the timeframe is extended to include further commitments in B.C. and Ontario in the following two years. Figure 3 also utilizes Statistics Canada’s population projections for each of those years.
Quebec and P.E.I. have always had higher coverage rates than other jurisdictions in Canada. They’re already at or above the federal target of 5.9 spaces per 10 children.
If they hit their CWELCC space creation counts, and if child population projections are accurate, Saskatchewan, Newfoundland and Labrador and Nova Scotia will likely hit the federal coverage target or come close. However, as noted above, none of these provinces is on pace as of the first quarter of 2025, placing doubt about their ability to meet their final CWELCC goals.
Manitoba and British Columbia will be within striking distance in 2027-28, but getting to the federal target of 5.9 licensed spaces per 10 children may be more of a stretch. Unfortunately, Manitoba is nowhere near where it should be in 2025, placing its longer-term goals in jeopardy. B.C., on the other hand, is on pace, slightly exceeding where it is targeted to be at this point.
At the other end of the spectrum is Alberta, Ontario and New Brunswick: even if they hit their CWELCC space creation targets, they will continue to have coverage rates below the target of 5.9 spaces per 10 children. Ontario is getting credit for its full-day, four-year-old junior kindergarten program and needs many fewer full-time child care spaces as a result, but coverage rates are still low. These provinces have been creating spaces since the CWELCC began in 2021, but it likely won’t be enough to relieve the pressure on parents to find a spot. So far, New Brunswick has slightly exceeded where it planned to be in 2025. Ontario is roughly on pace for its planned expansion in 2025. But Alberta isn’t on pace. Unless policies change rapidly, Alberta will likely miss its 2027-28 target, which would have resulted in low coverage rates in any event.
Of the more populous provinces, Ontario, Alberta and B.C. parents will likely continue to face long wait lists and frustration finding a spot even if all the CWELCC space creation targets are met. Parents will see low-fee child care spaces, they’ll just struggle to secure one.
Creating new spaces isn’t the only way in which the coverage can improve. Canada has an aging population, which means families aren’t having enough children to replace those that age up: the population of young children is dropping. That trend is reflected in Statistics Canada’s youth population projections.8Statistics Canada, Table 17-10-0005-01, Population Estimates on July 1, By Age and Gender, (https://www150.statcan.gc.ca/t1/tbl1/en/cv!recreate.action?pid=1710000501&selectedNodeIds=1D2,1D3,1D4,1D5,1D6,1D7,1D8,1D9,1D10,1D11,3D2,3D3,3D4,3D5,3D6,3D8&checkedLevels=1D1&refPeriods=20200101,20240101&dimensionLayouts=layout3,layout2,layout2,layout3&vectorDisplay=false ) and Statistics Canada, Table 17-10-0057-01, Projected Population, By Projection Scenario, Age and Gender, as of July 1 (https://www150.statcan.gc.ca/t1/tbl1/en/cv!recreate.action?pid=1710005701&selectedNodeIds=1D2,1D3,1D4,1D5,1D6,1D7,1D8,1D9,1D10,1D11,2D3,4D3,4D4,4D5,4D6,4D7,4D9&checkedLevels=2D1&refPeriods=20250101,20270101&dimensionLayouts=layout3,layout2,layout2,layout2,layout3&vectorDisplay=false ).
A declining child population bodes badly for the long-term labour market and economic growth, but it has the practical effect of improving child care access. If the count of licensed spaces is maintained and the non-school aged population falls, then the child care coverage rate will improve because it will be easier to secure a spot.
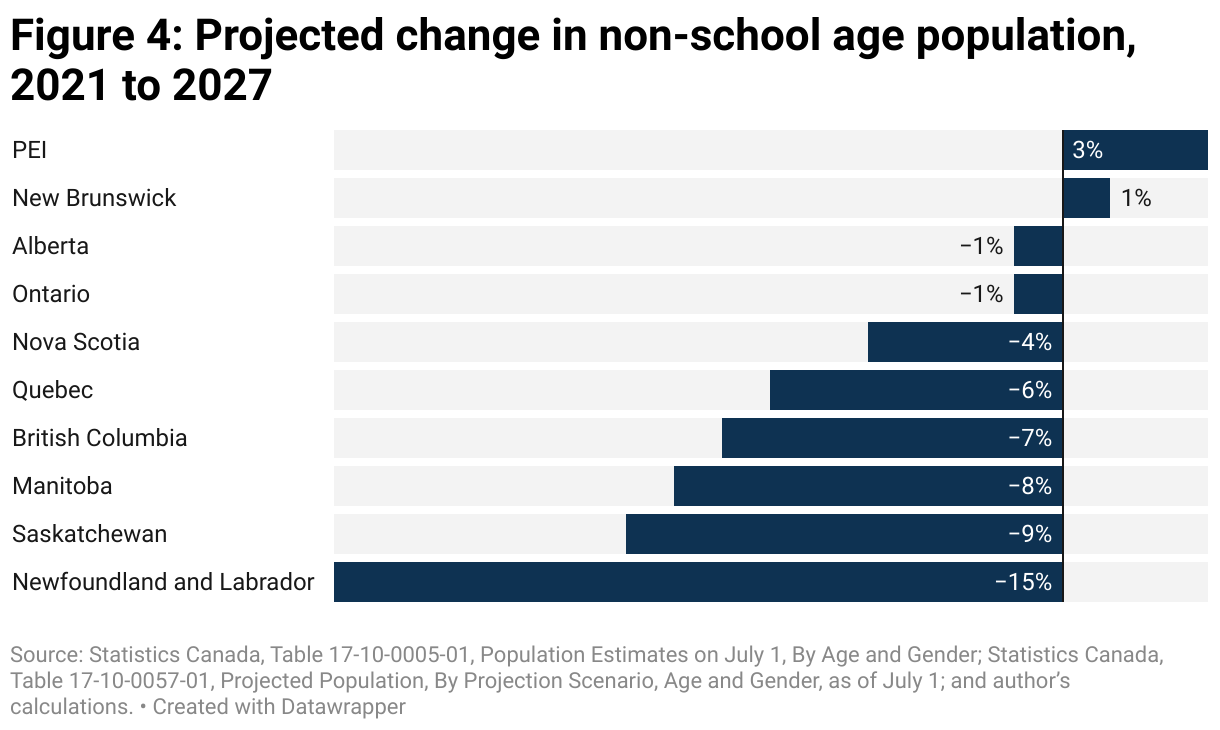
If we look at these trends provincially in Figure 4, the projected decline of young children is largest in Newfoundland and Labrador, falling by 15 per cent between 2021 and 2027. But it isn’t the only province seeing this trend. There are also big projected drops in Manitoba, Saskatchewan and B.C., losing just under 10 per cent of their young children population over the CWELCC period. This decline in the child population is simply a result of current children progressing into school age and not being entirely replaced by new babies and net new immigration.
The young child population in Ontario and Alberta are projected to be roughly the same, while Quebec’s young population is projected to fall six per cent by 2027.
Population projections, in Figure 4, from 2025 through 2027, can change—they are about the future and can be heavily influenced by government policy. The projections available at the time of publication, for instance, had yet to incorporate significant federal policy changes to international student programs and reductions in immigration targets more generally.9See Immigration, Refugees and Citizenship Canada, “Government of Canada reduces immigration”, October 24, 2024, https://www.canada.ca/en/immigration-refugees-citizenship/news/2024/10/government-of-canada-reduces-immigration.html. These federal immigration restrictions will likely reduce child population growth.
No province wants to see their child population decline, because it presages a declining future. More affordable child care that is of high quality and broadly available can act as a bulwark against these trends.
As we examine more fine-grained coverage rates below, these changes in child population are incorporated. Population changes from July 1, 2024 are known and incorporated. The only projections for the first quarter of 2025 data below are for the three quarters between July 2024 and April 2025. A declining population of young children improves coverage rates and rising child counts worsens coverage rates if there is no change in licensed spaces. See the methodology for a longer description of how this is accomplished.
CWELCC expansion has been a for-profit affair
An important stipulation of the CWELCC agreements is that the spaces created be primarily non-profit or public (run by local governments, school authorities or Indigenous governing bodies). With the costs of the child care system in most provinces and territories now being paid almost entirely from the public purse and only a small amount coming from parent fees, this has largely become a publicly funded system (although parental fees still remain high at the time of publication in both Nova Scotia and British Columbia).10David Macdonald and Martha Friendly, From Market to Managed: The uneven path to $10 a day child care, Canadian Centre for Policy Alternatives, July 2025. Ensuring high quality while maintaining cost containment likely led to the inclusion of this rider.
Numerous studies have demonstrated a strong and persistent relationship between ownership type and quality, with non-profit child care consistently outperforming for-profit child care across key indicators, even when controlling for a wide range of variables.11Gordon Cleveland and Michael Krashinsky, “The Nonprofit Advantage: Producing quality in thick and thin child care markets,” Journal of Policy Analysis and Management, 28, no. 3 (2009): 440–460, https://doi.org/10.1002/pam.20440; Martha Friendly, et al., Risky Business: Child Care Ownership in Canada Past, Present and Future, Childcare Resource and Research Unit, 2021; Gordon Cleveland et al., An Economic Perspective on the Current and Future Role of Nonprofit Provision of Early Learning and Child Care Services in Canada, University of Toronto, 2007;Elizabeth Dhuey, “Will the Increased Investment in Early Childhood Education and Care in Canada Pay Off? It Depends!” Canadian Public Policy, 50, no. S1, April 2024. Non-profit centres are overrepresented at higher levels of quality and underrepresented at lower levels of quality.12Cleveland and Krashinsky, 2004; Drouin et al., 2004, cited in Friendly et al., Risky Business. These quality differences are closely tied to labour practices. Non-profit providers tend to hire better-trained staff, pay higher wages, and invest in more professional development, which supports a stronger culture of quality.13Friendly et al., 2021; Cleveland and Krashinsky, 2009; Cleveland et al., 2007. Several jurisdictions have province-wide wage scales, reducing the wage advantage for non-profits there. In contrast, for-profit centres, driven by the need to generate returns, will often cut investments in staffing, leading to lower wages, fewer trained workers, and greater non-compliance with legislated ratios.14Friendly et al., 2021, 10. While some assume that higher wages in non-profits may reduce cost efficiency, research shows no significant difference in operational efficiency between the sectors.15David M. Blau and H. Naci Mocan, “The Supply of Quality in Child Care Centers,” Review of Economics and Statistics 84, no. 3 (2002): 483–496. In fact, non-profits tend to allocate resources more effectively toward service quality.16Cleveland et al., 2007. Unlike for-profit providers, non-profits reinvest 100 per cent of revenue into service delivery,17Goelman, H., Forer, B., Kershaw, P., Doherty, G., Lero, D., LaGrange, A., “Towards a Predictive Model of Quality in Canadian Child Care Centers,” Early Childhood Research Quarterly, 21: 280–95, 2006. making them more publicly transparent, sustainable.18Cleveland et al., 2007; Dhuey, 2024; Kershaw, Paul, Barry Forer, and Hillel Goelman, 2005, “Hidden Fragility: Closure among Licensed Child-Care Services in British Columbia,” Early Childhood Research Quarterly, 20 (4): 417–32, .
Our CLAR database contains ownership and chain information on all centres. Below, the non-profit category includes centres run by community not-for-profit organizations (including cooperatives), municipalities, school boards, and Indigenous governing bodies. These can be differentiated from the CLAR database but are grouped for ease of comparison below.
Since 2022, 57 per cent of all the net new licensed child care spaces for non-school age children were for-profit spaces. Only 30 per cent were public or non-profit, and the remainder were new homes. This hasn’t been a Canada-wide public expansion of child care—it has been an overwhelmingly for-profit expansion.
The expansion in new spaces since 2022 was almost entirely for-profit in Alberta, British Columbia and New Brunswick. P.E.I. also saw most new spaces created on the for-profit side, but they didn’t add that many.
The licensing of new homes played a major role in Ontario and Saskatchewan’s expansion of spaces. Although it’s not clear if these are “new” or merely shifting from unlicensed to licensed homes. There is a clear incentive for home-based child care providers to make the shift, because moving over allows them to offer much lower fees.
While homes can legally operate without a license, if they meet specified staff:child ratios, centres generally cannot operate without a license, so space creation on that side is more reliably “new”. British Columbia recorded a decline in the number of homes, although this was due to several of them converting from home licenses to centre licenses—a peculiarity only possible in B.C.’s licensing system.
Non-profit expansion is more evident in Manitoba and Saskatchewan, although almost all spaces were already non-profit. Since 2022, most new spaces created in Newfoundland and Labrador, as well as Nova Scotia, have been non-profit.
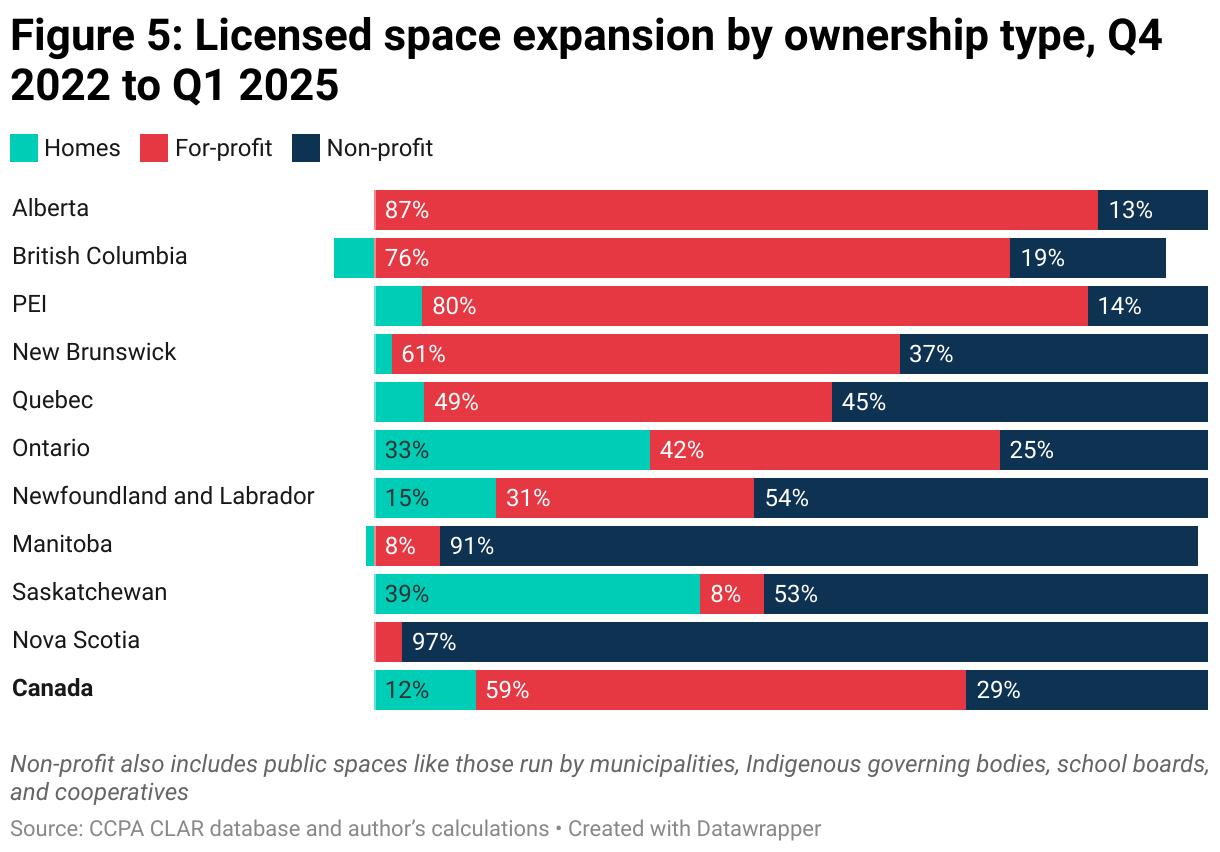
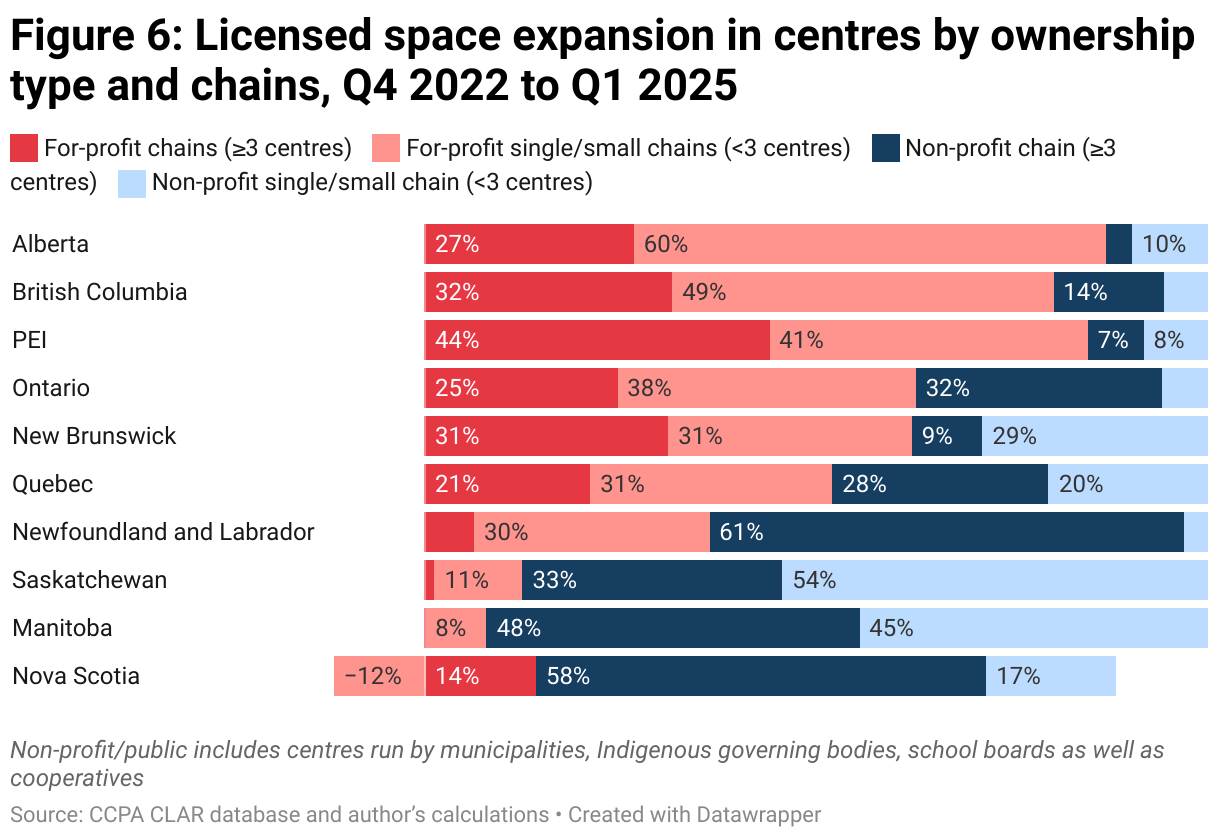
Figure 6 focuses on centre spaces and excludes homes, which may not be “new” but may just be shifting into the licensed sector. Here, we’re also looking at chains which have three or more facilities versus individual facilities or small chains with fewer than three sites. The non-profit/public category includes centres run by municipalities, school boards, Indigenous governing bodies and cooperatives.
Across the country, most of the growth in centre spaces has been by for-profit single operators or small chains. They’ve made up 42 per cent of the expansion of spaces in centres. Larger for-profit chains, with three or more sites, make up a quarter of the growth. Larger non-profit chains make up 21 per cent of the licensed space growth.
Space expansion in Alberta’s centres has been almost exclusively on the for-profit side and most of that has been among small operators. There has been almost no expansion of non-profit chains in Alberta, but a small proportion of new spaces are being created by small non-profits.
Just under half of B.C.’s new centre spaces have been created by for-profit single operators and small chains. Another third of the new licensed spaces in B.C. were from larger for-profit chains.
Ontario’s growth in licensed, non-school age spaces was more balanced, but by no means a non-profit led. The largest single creators in Ontario were small for-profit operators, followed closely by non-profit chains. Quebec had all four segments producing roughly the same number of spaces.
Newfoundland and Labrador, Saskatchewan, Manitoba and Nova Scotia did have non-profit-led expansions, as the CWELCC agreements intended. Non-profit chains led the way in Newfoundland and Labrador and Nova Scotia, while smaller non-profits did the heavy lifting in Saskatchewan and Manitoba (although these provinces were already dominated by this type of provision). In these four provinces, for-profit providers also expanded but they didn’t make up the majority of the space creation.
The major non-profit chain expansion in both Newfoundland and Labrador and Nova Scotia were led by the YMCA. In the Newfoundland and Labrador, it was due to the YMCA receiving the contract to provide the province’s pre-kindergarten child care program.
In Nova Scotia, we see a net decline in single-site, for-profit spaces. This isn’t because spaces were lost, it’s because they were taken over by larger non-profits chains. For instance, the YMCA took over Beaver Bank Children’s Learning Center Ltd. and Jane Norman College took over My Pride & Joy Child Learning Centre Inc.
While the promise of CWELCC, written into all the agreements, was a clear preference for the expansion of public or non-profit spaces to improve quality and contain costs, exactly the opposite has happened in most provinces.
Child care access and improvement by province
Building up from block level calculations
As illustrated above, the availability of child care differs greatly by province. But in the end, child care is local, and evaluating access needs to reflect that. Extra spaces in one city does not help parents seeking those spaces in a different city. This is true even in the same city, if there are extra spaces on the east end, that doesn’t help parents on the west end, unless they want to spend their day in traffic.
In the previous version of our child care accessibility reports, a simpler methodology for child care access was used. For every Forward Sortation Area (FSA), the first three digits of the postal code, the count of non-school age, licensed spaces and the population of young children were compared as a ratio. In cities, FSAs are geographically small and are a good proxy for neighbourhoods, although this is less true in smaller towns and rural areas. As well, FSAs are simply geographic boxes drawn on a map, which create boundary effects. This is where all the kids live on one side of a postal code line, but all the spaces are on the other. One side looks like a child care desert and the other a child care oasis. In real life, parents just cross that line to get to nearby child care.
In this report’s detailed geographic analysis, we don’t use FSA as the unit of analysis, as we did in the past. Therefore, this paper’s analysis won’t be directly comparable to previous versions. Instead of using the 1,666 FSAs, we use 55,000 Dissemination Areas (DA) in Canada. DAs are roughly equivalent to a city block or two and contain roughly 400 to 700 people. Around each DA, we’re drawing a 5 km radius circle in cities and towns or a 10 km radius in rural areas and finding all licensed child care spaces within those circles. Using a Two-Step Floating Catchment Area (2SFCA) approach, we’re adjusting the coverage rate for the fact that those same spaces may be falling within other overlapping circles for other DAs. Thus, there are no boundary effects. For more see the methodology.
The result is that we have calculated child care accessibility at the city block level for the over 55,000 DAs in Canada with data. This very fine level of child care accessibility can be rolled up to higher levels of geography, like cities, regions or provinces, through weighted averages or counts by different categories of access. As before, we’re only looking at non-school age children and the licensed spaces for which they are eligible.
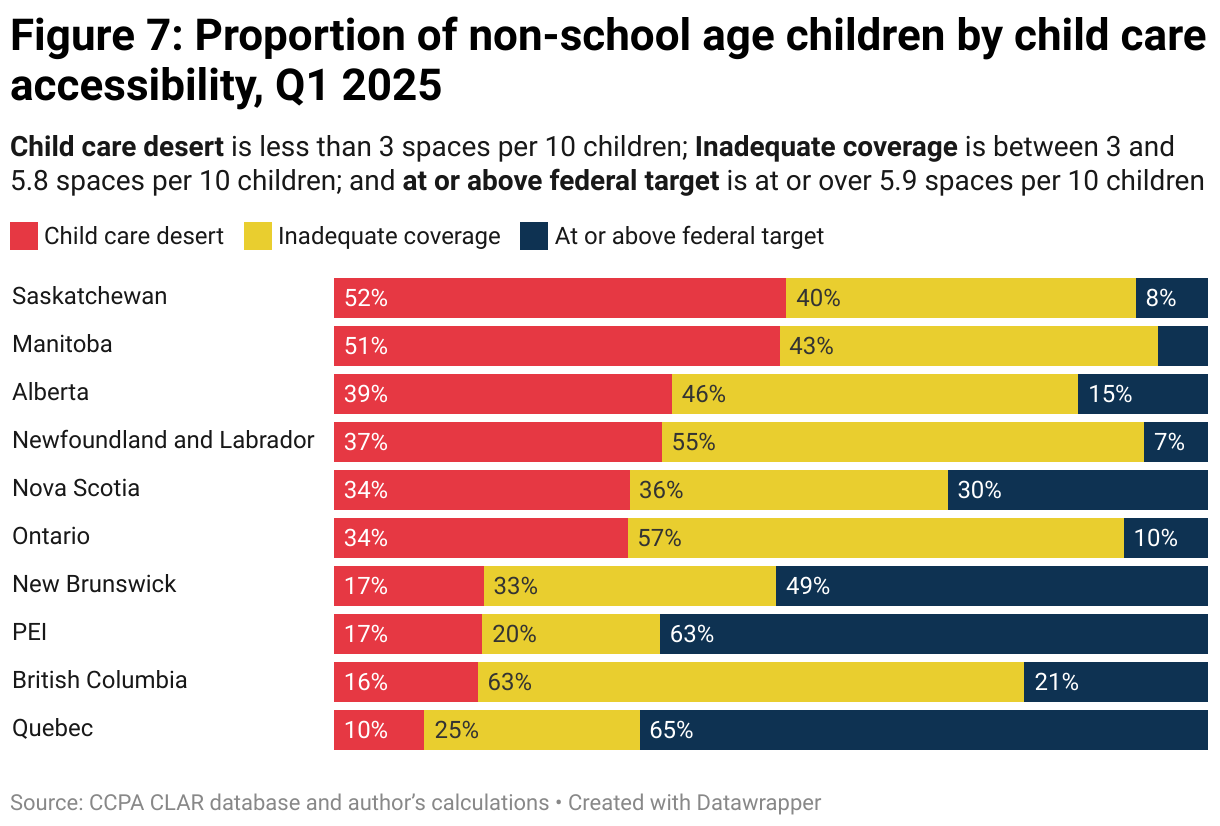
We’re often grouping children based on three thresholds: less than three spaces nearby for every 10 children—a child care desert; between three and 5.89 spaces per 10 children—inadequate coverage; and over 5.9 spaces per 10 children—adequate because this meets the federal interim target of 59 per cent coverage rate.
How many children are getting the target coverage rate
When it comes to accessing child care in Canada this year, there is a huge variety of experiences.
We saw above that both Quebec and P.E.I. have higher than average coverage rates that are already at or above the federal target of 5.9 spaces per 10 children. But the average doesn’t tell you the whole story. In both provinces, two thirds of kids already live on blocks that have 5.9 (or more) nearby child care spaces per 10 children. However, 10 per cent of children in Quebec and 17 per cent of children in P.E.I. live on a block with fewer than three spaces per 10 children nearby—what we’re calling a child care desert. Despite doing well on average, looking in finer detail illustrates that there is still plenty of work to do: more than 45,000 children in Quebec live in child care deserts and more than 1,400 children in P.E.I. live in child care deserts.
Just over half of New Brunswick children living on blocks have hit the federal target. It has a similar proportion of kids living in a child care desert as P.E.I., at 17 per cent. However, it has a lot more children than P.E.I. living in between a desert and the target coverage. They have some spaces nearby, but not nearly enough.
British Columbia has 16 per cent of its children living in a child care desert—relatively low compared to other provinces. However, relatively few B.C. children live on a block that meets the federal target. Two-thirds of children in B.C. live on blocks with between three and 5.89 spaces per 10 children. B.C. also has a lot of part-time spaces. These are pro-rated to 0.5 of a full-time space, but many provide much less than that, at two to three hours a day for two to three days a week. That is too little child care to support labour force participation. This may suppress the desert count somewhat.
The prairie provinces of Saskatchewan, Manitoba and Alberta are at the other end of the spectrum. They have poor average coverage rates and this is reflected in these more detailed statistics. Roughly half of children in these provinces are living in a child care desert and only 10 per cent of children are living on blocks with adequate child care access at or above the federal target.
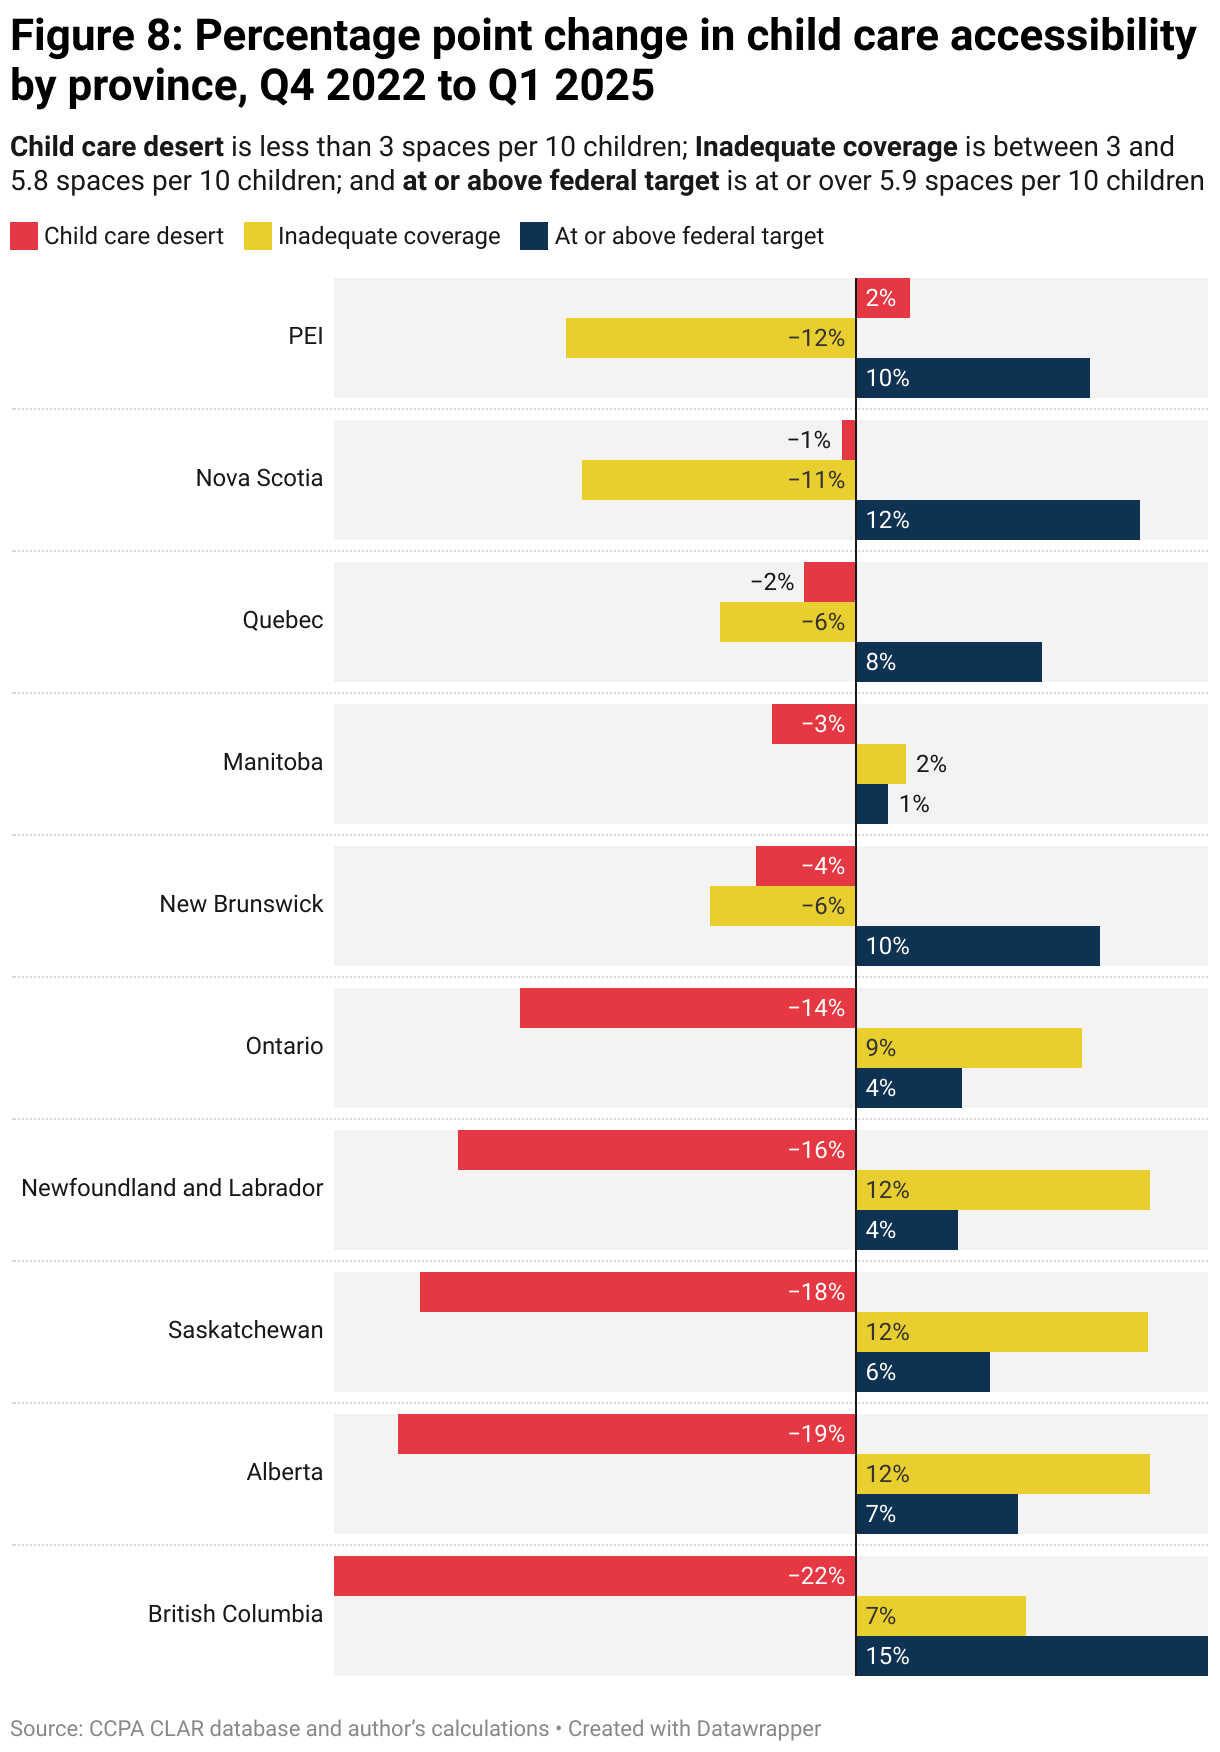
While many children in Canada continue to live in child care deserts, there have been notable improvements since 2022. As noted above, improved access can be the result of more spaces or of declining child populations; both effects are included.
Figure 8 compares the proportion of child population that was in each access category in 2022 vs. 2025.
British Columbia saw the biggest proportional reductions in the number of kids living in a child care desert. It cut its rate from 38 per cent of children in a child care desert in 2022 to 16 per cent today, a drop of almost a quarter. B.C. also substantially boosted the kids living on blocks that meet federal targets, which was six per cent of kids in 2022 and is now 21 per cent.
Alberta, Saskatchewan, Newfoundland and Labrador and Ontario reduced the proportion of their children living in child care deserts by roughly 15 percentage points. Saskatchewan still has the largest proportion of its child population living in child care deserts, at 51 per cent, but the situation has improved from where it started in 2022, at 70 per cent.
P.E.I., Quebec, Nova Scotia and New Brunswick have managed to increase the proportion of their children living at or above the federal target by roughly 10 percentage points.
Determinants of child care deserts
Dissemination areas (DA) are a Statistics Canada geographical category, which means that other census variables can be readily connected to the child care accessibility statistics. This section examines the connection between child care access versus community size and family income.
There are four Statistics Canada community sizes available for each DA, ranging from a big city of over 100,000 people to a rural area.
It’s often thought that it’s harder to serve child care in rural areas or small towns. Yet child care is very scalable: centres can be smaller for smaller communities or individual homes can be licensed to serve small populations. Also, the distance that counts as nearby in our child care accessibility calculations is expanded from 5 km to 10 km radius in rural areas.
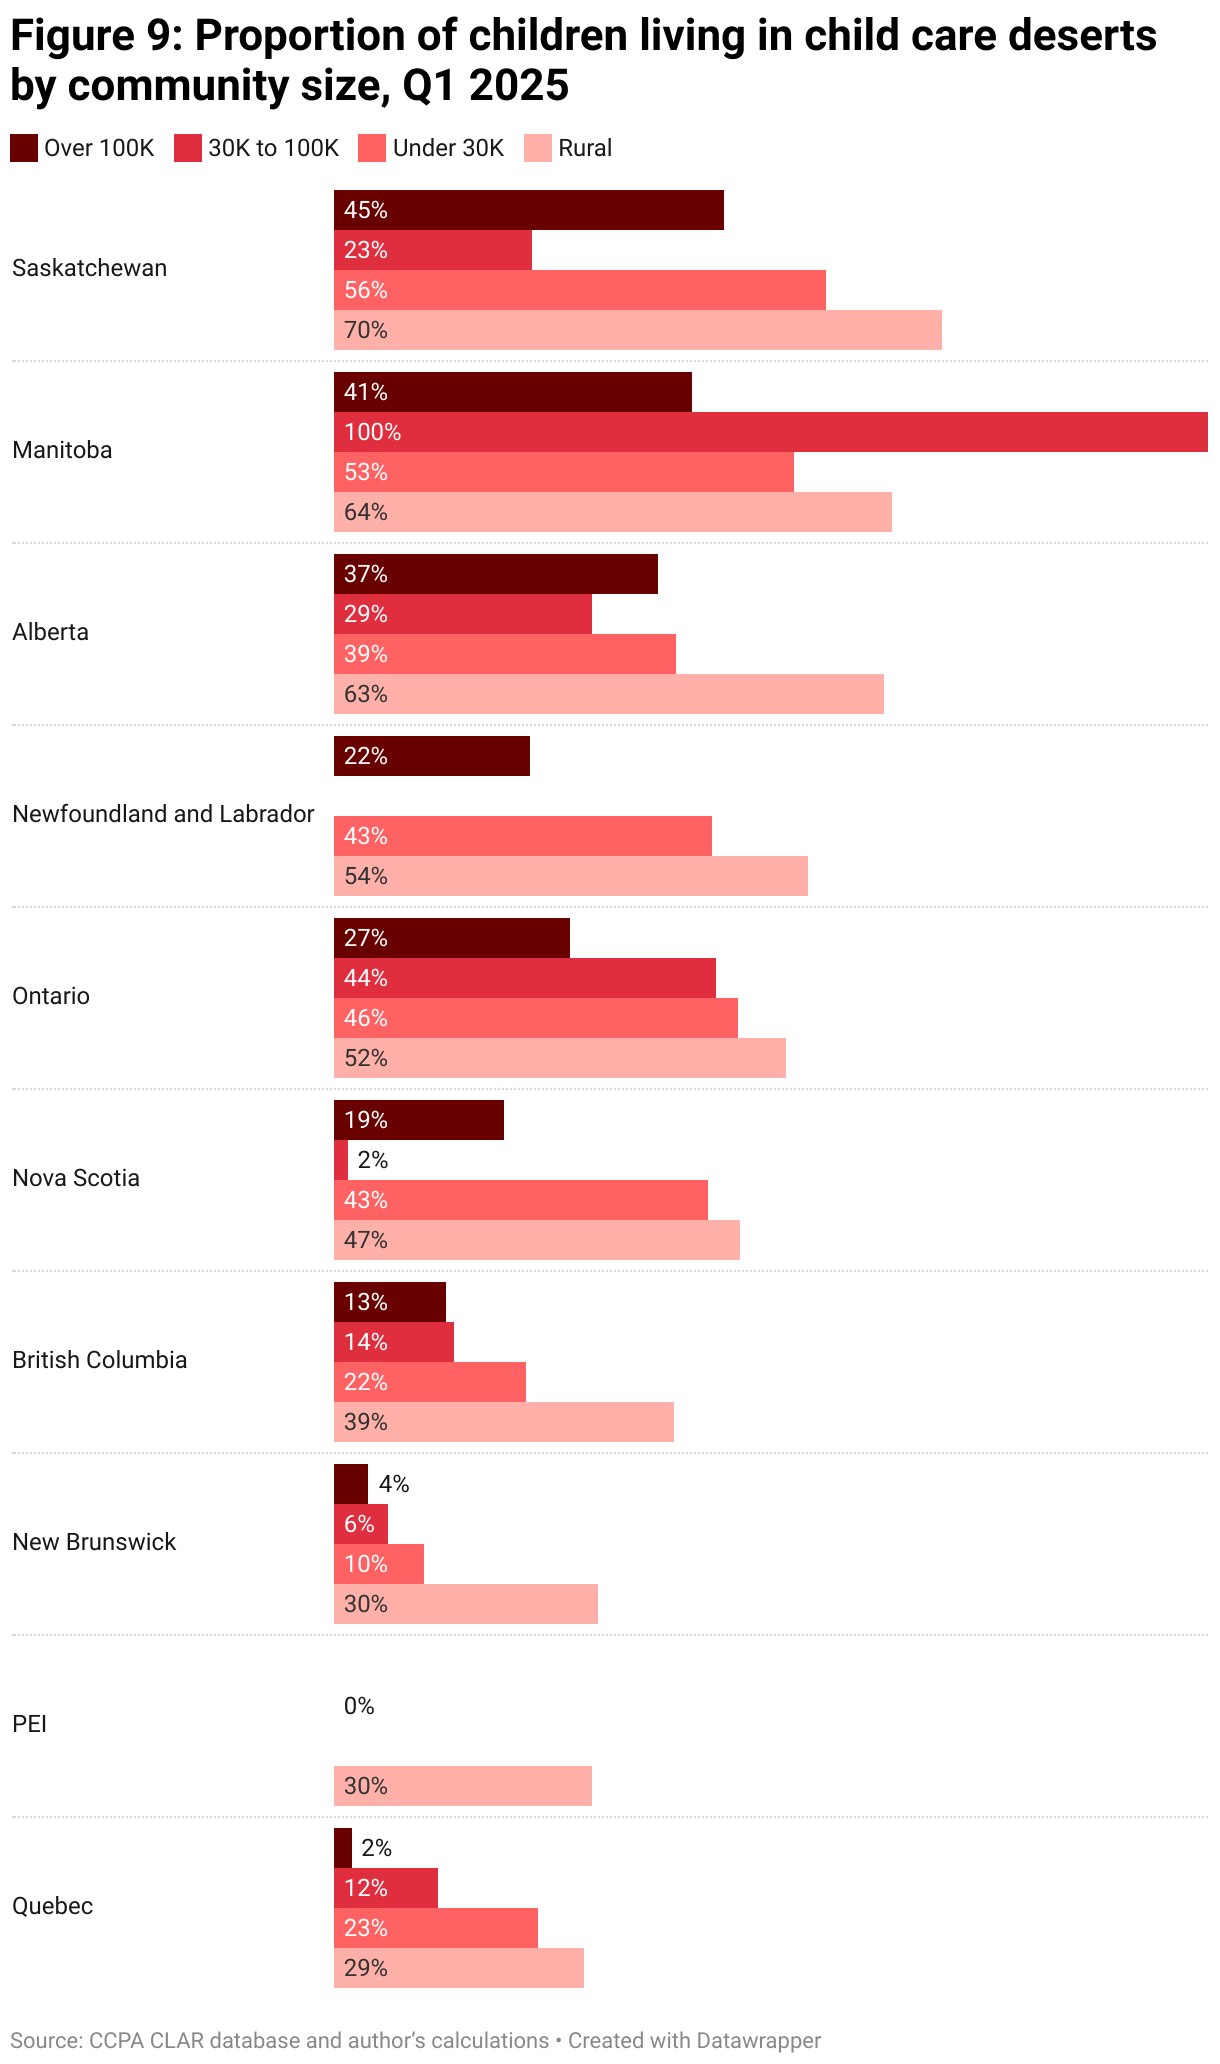
As shown in Figure 9, there is a clear gradation in the proportion of children living in a child care desert between urban and rural areas. For example, in Saskatchewan, 70 per cent of children in rural areas live in a child care desert, which falls to 56 per cent in small towns and eventually ends up at 45 per cent of children living in the big cities of Saskatoon and Regina.
While the gradation of child care access based on community size is relatively consistent within provinces, it’s quite different province to province. These provincial differences show that good child care accessibility in rural areas isn’t out of reach. For instance, only 30 per cent of children are living in a child care desert in rural Quebec, P.E.I. and New Brunswick. But this is a far better result than the biggest cities of Alberta, Saskatchewan and Manitoba. Rural Quebec children enjoy better access to child care than children in Edmonton, Calgary, Winnipeg or Regina.
If we look at Charlottetown or the big cities in Quebec, almost no children live in child care deserts. Contrast that to the Prairie provinces, where 40 per cent to 50 per cent of children in big cities live in deserts.
Child care is sometimes criticized as a program for the upper-middle and rich families. We can examine that proposition from an accessibility perspective by asking: is it only rich kids who have child care nearby?
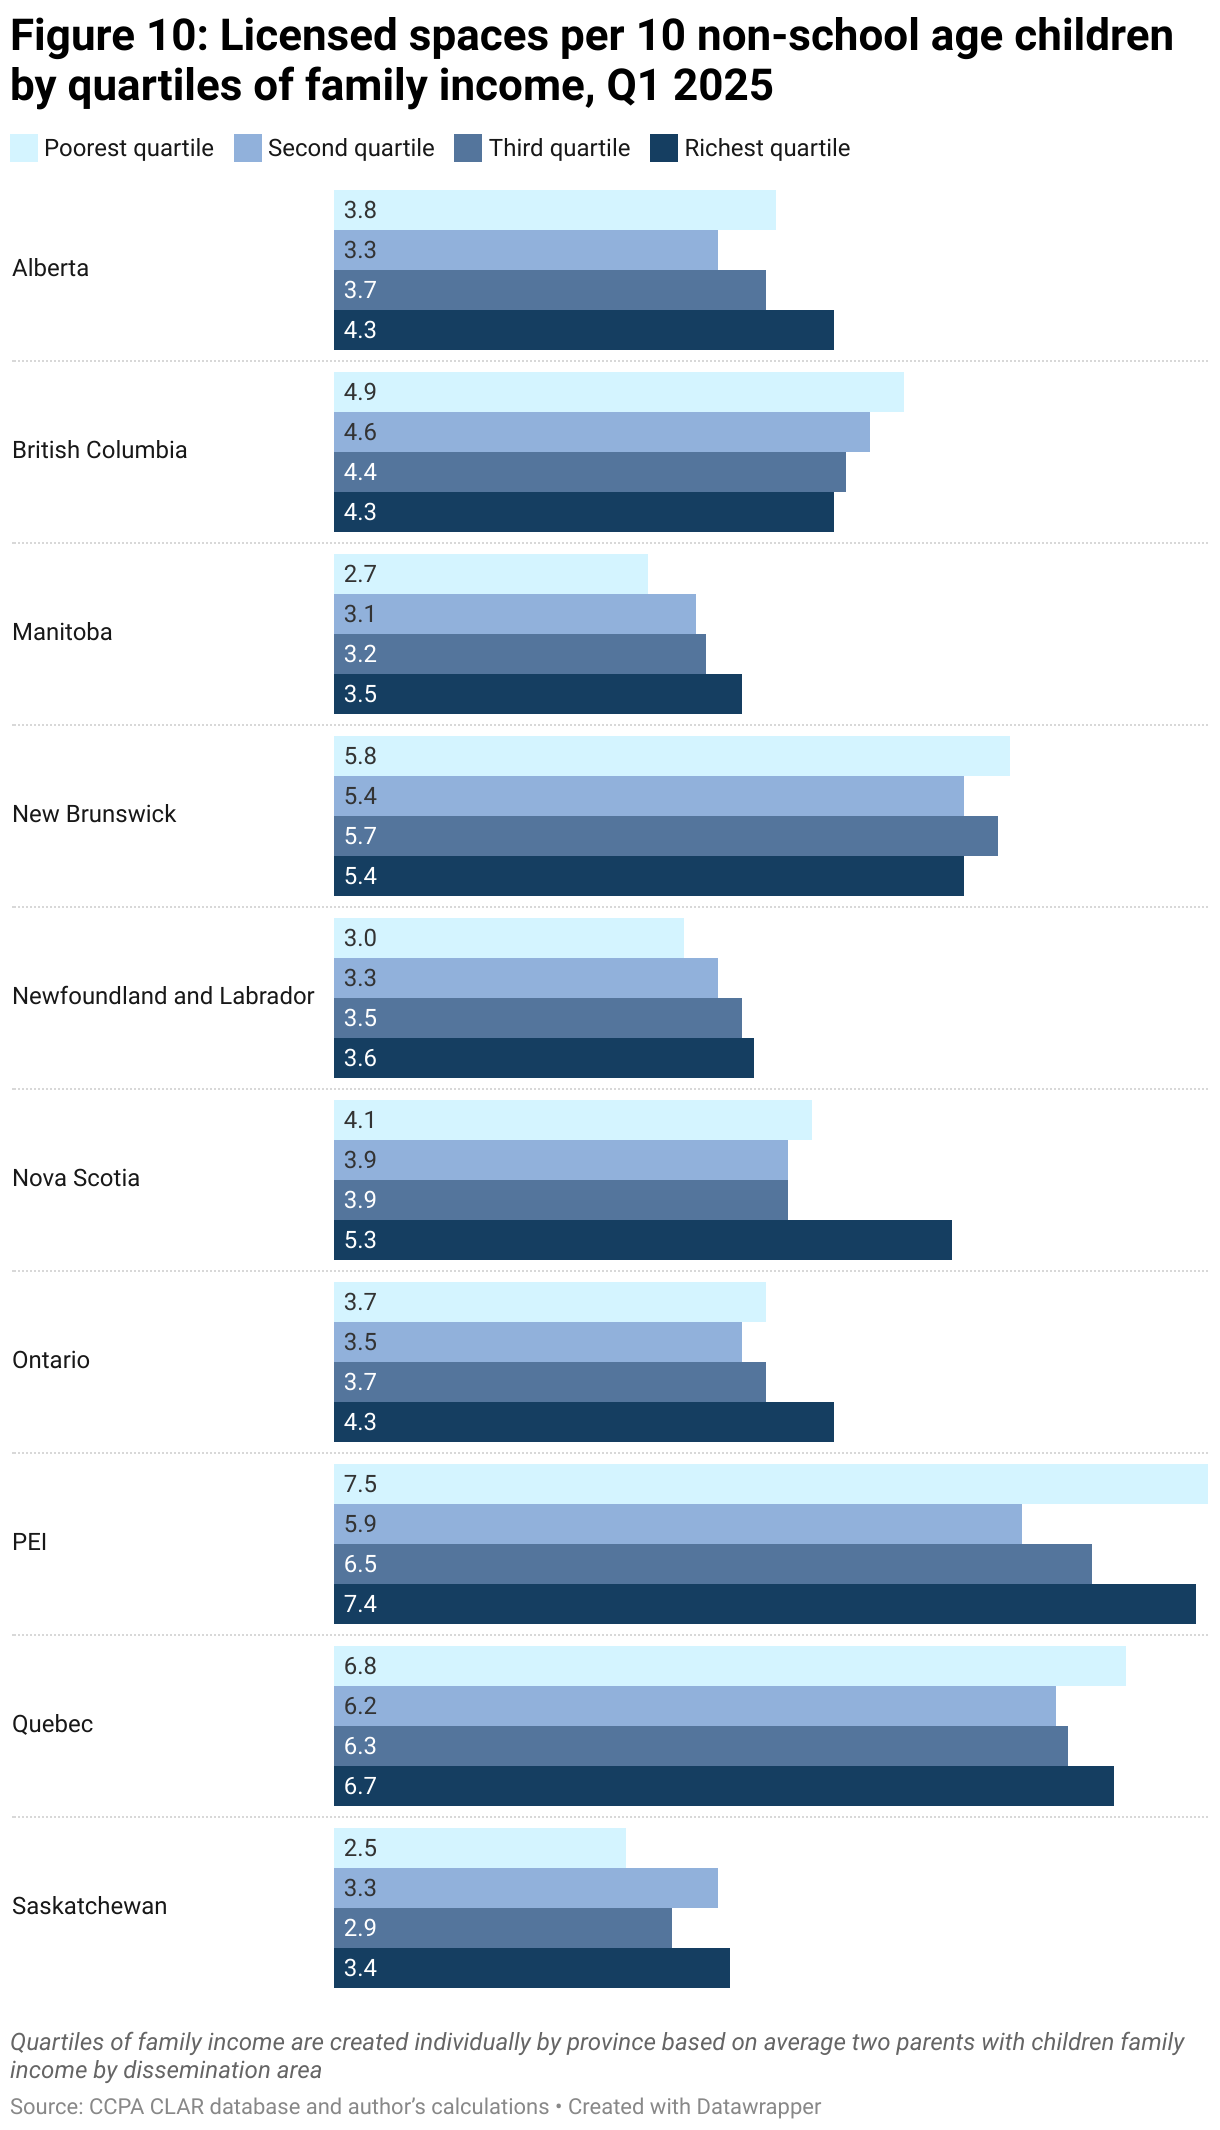
Unlike the comparison of child care access by community size, the answer is not at all clear. Figure 10 doesn’t show a consistent connection between parental income and child care access. In some provinces, like Manitoba, high-income parents have better access to childcare than poor or middle-class parents.
In other provinces, like B.C., we see the opposite trend. In most cases, the access rates are relatively equal across income. High-income city blocks don’t necessarily have better child care access than low-income ones.
In six of 10 provinces, the best access is found on city blocks where incomes are the highest. But in the other four, the best access is found where parents have the lowest incomes in those provinces.
Obviously, having a licensed child care space nearby and being able to pay for it are two different things. Even if geography isn’t an impediment to access for lower-income families, high fees certainly can be. Low set fees that can be lowered further based on income, reducing the financial component of the access barrier. Lower universal set fees in most jurisdictions have been a common feature of CWELCC implementation. However, graduated lower fees for low-income families are less common.
More research needs to be done on the determinants of child care access, which goes beyond the scope of this paper. However, the CLAR database provides the means to conduct such research.
Child care deserts in Canada’s big cities
Most children in Canada live in big cities with over 100,000 people and our very fine level of detail allows us to look at access rates within cities. Similar to the provincial analysis, we’ll have three broad coverage thresholds: desert (zero to three spaces per 10 kids), inadequate (three to 5.89 spaces per 10 kids), adequate (>=5.9 spaces per 10 kids).
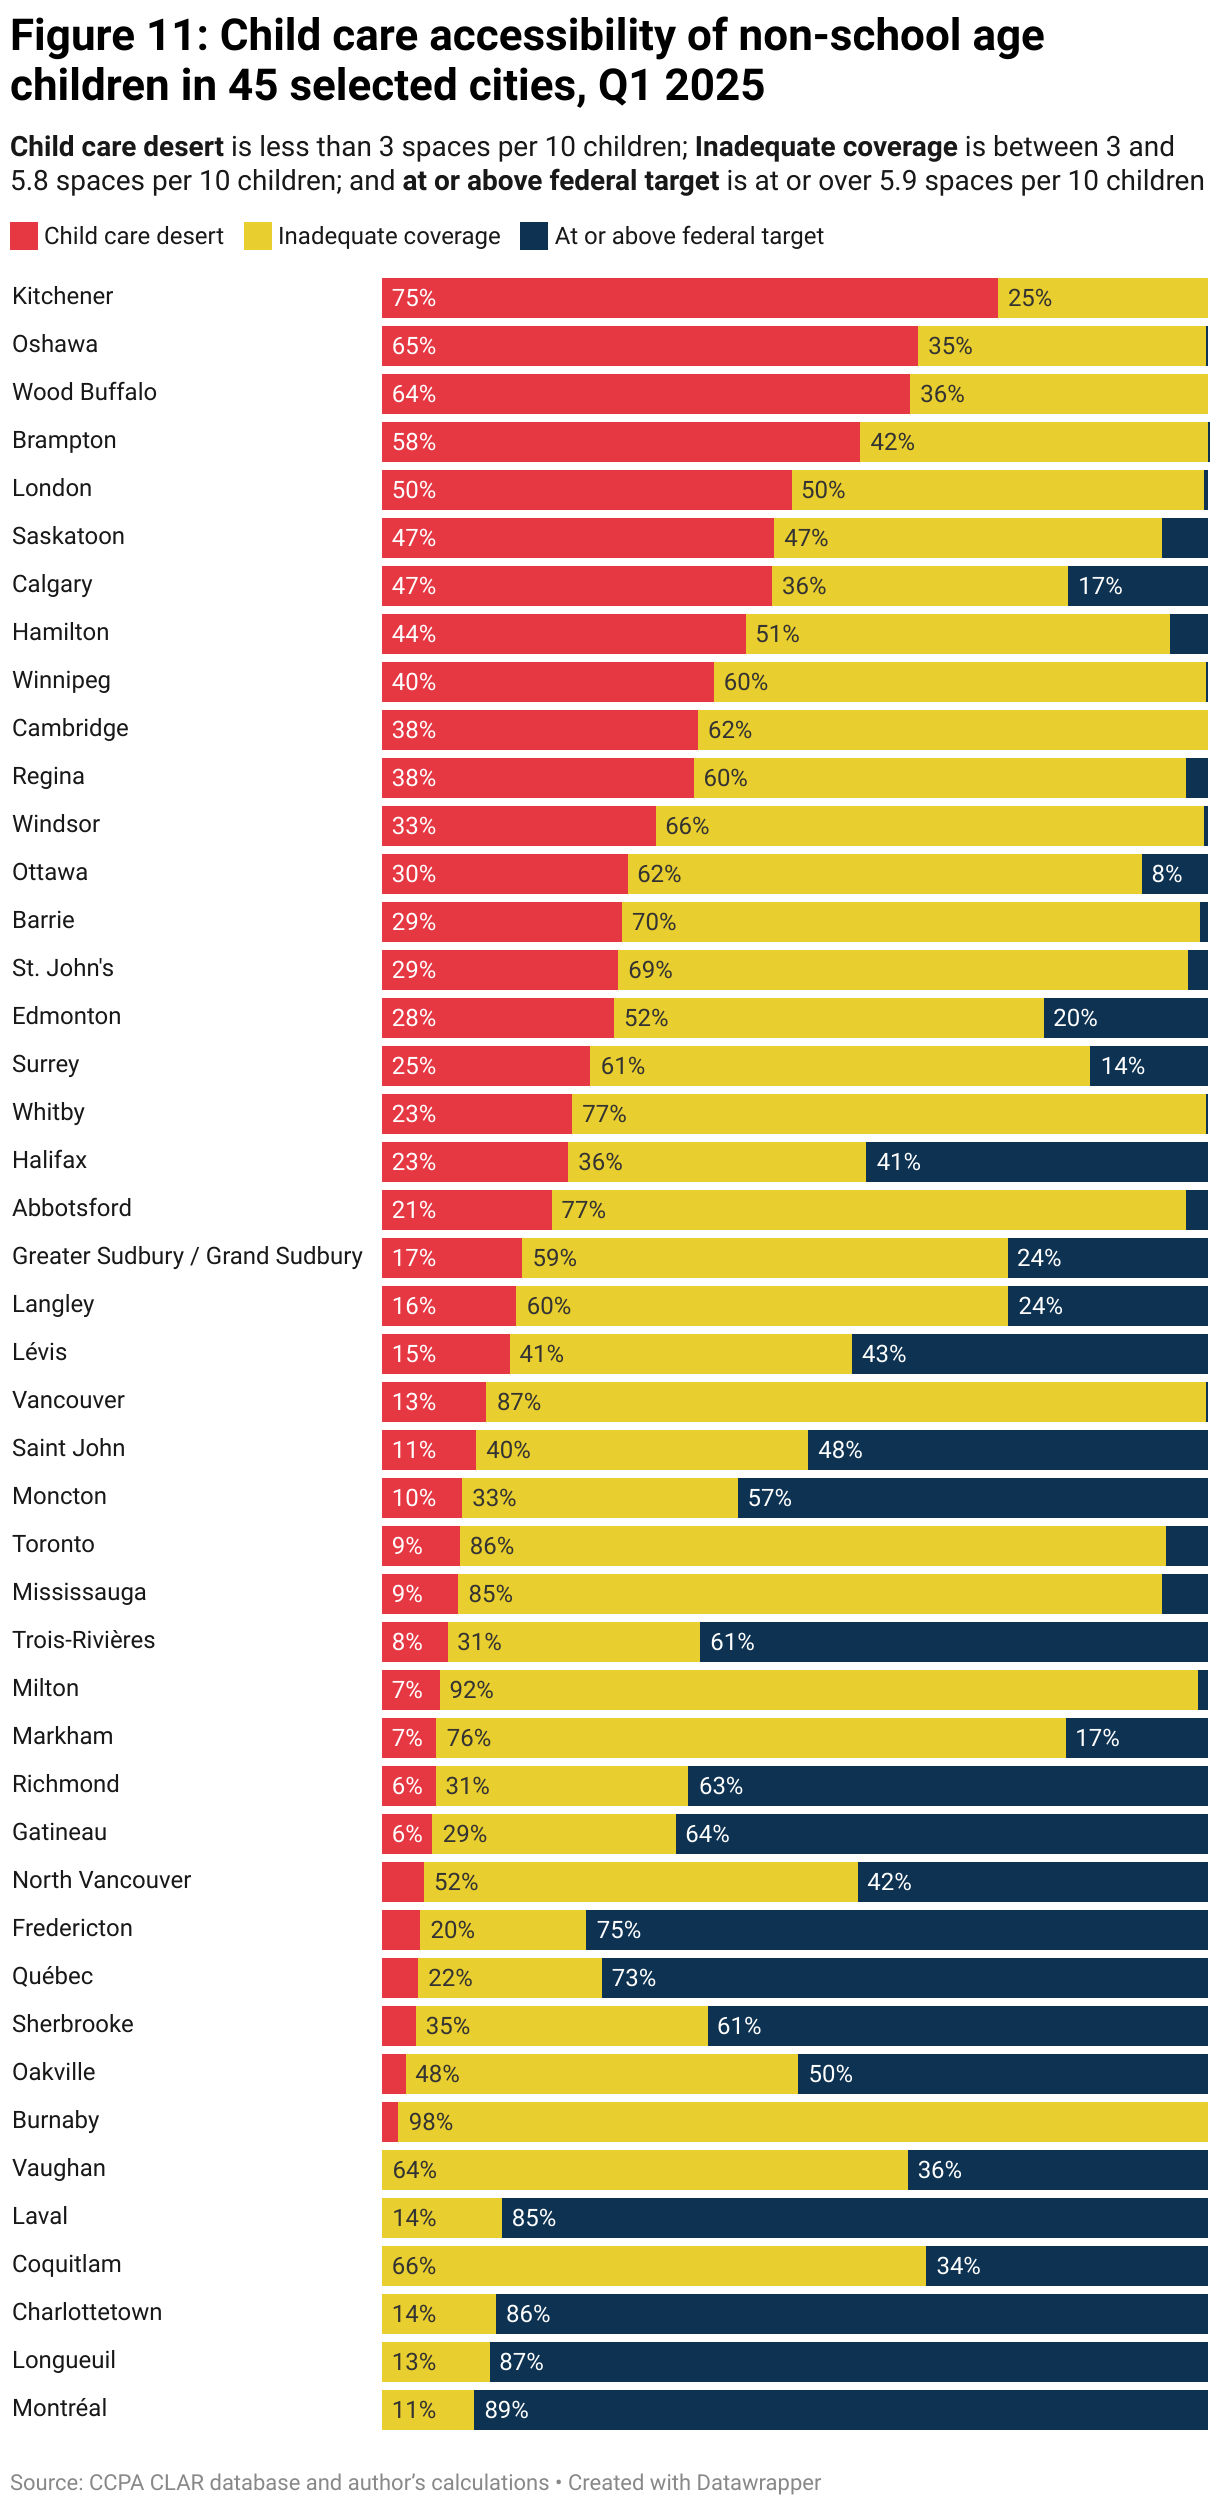
Figure 11 provides an overview of selected cities in Canada, including at least one in every province and cities in different regions of a given province. These aren’t the largest 45 cities in Canada.
Kitchener, Oshawa and Wood Buffalo (Fort McMurray) have three quarters of their children living with little licensed child care nearby, adjusting for the needs of other blocks of children. Child care deserts where there are few, if any licensed spaces nearby, make it very difficult for parents in these cities to find care, even if fees have fallen.
While half of the children in Calgary live in child care deserts, there is a surprising minority of 17 per cent of children who enjoy the federal target of 5.9 nearby spaces per 10 kids. This illustrates how unequal the distribution of child care deserts can be.
At the other end of the spectrum, many of Quebec cities and Charlottetown have almost no children living in deserts and almost all blocks meet federal targets of at least 5.9 spaces per 10 children.
Some cities—like Vaughan, Coquitlam, Burnaby and Oakville—buck their provincial trend and also have almost none of their children living in child care deserts, although most of the children in these cities have inadequate coverage, with between three and 5.89 licensed spaces per 10 kids. These cities also have large minority populations that do have child care nearby that meet the federal target.
The space expansion required to hit federal targets
The political saleability of CWELCC is now dependent on rapid space expansion.
Fees are much lower compared to pre-CWELCC, even if they are not universally at $10 a day. However, without rapid, high-quality, licensed child care space expansion, wait lists threaten to balloon. Also, the broader societal benefits of more child care spaces—which includes economic growth, female labour force expansion and tax revenue generation—are largely achieved only if enough parents can find a spot. While the raw counts in the CWELCC agreements are roughly on track, achieving these goals won’t matter if the practical experience of parents in key provinces is that they can’t find a spot.
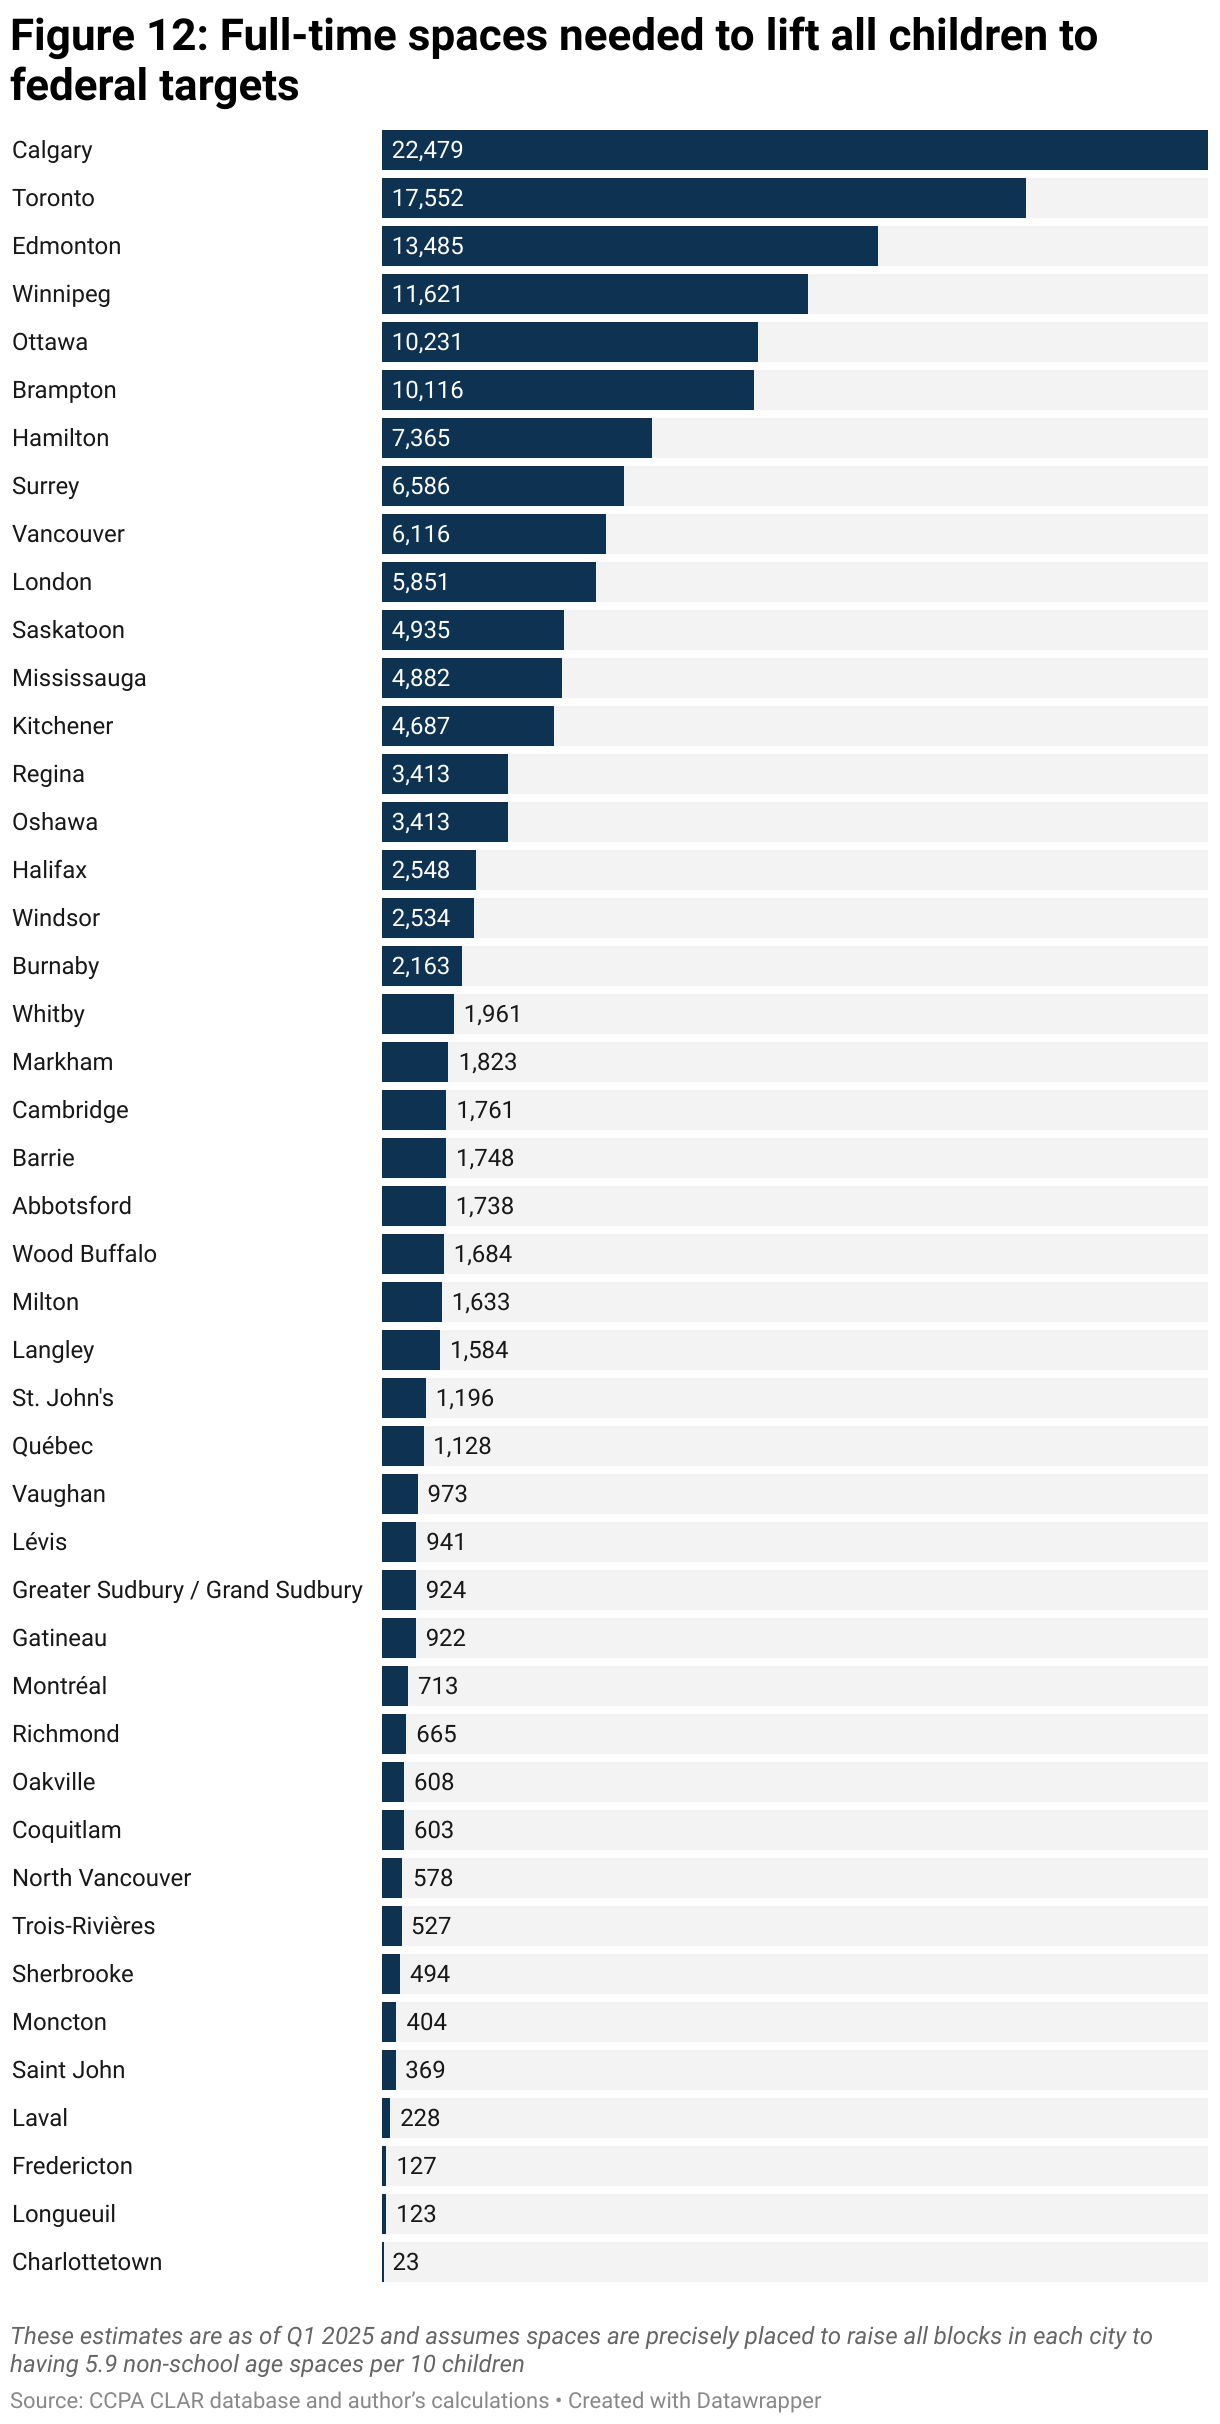
Figure 12 examines the minimum number of spaces needed, by city, so that within 5 km of their house there are at least 5.9 licensed spaces for every 10 children. These estimates should be seen as minimums because they assume that every new space is perfectly placed to push coverage rates up to the 5.9 spaces per 10 children.
The estimates in Figure 12 are as of the first quarter of 2025, and some of that needed expansion is built into the spaces promised under the CWELCC agreements for the coming years. The provinces have already added 158,572 spaces since 2021, but they’ve promised 303,694 by 2027-28. If the entirety of all space creation by 2027-28 went only to these 45 cities and nowhere else, it would fall short of what’s needed to bring their child populations up to the federal standard.
To accurately place new spaces requires public planning. This sort of analysis is regularly conducted by school boards, but, until recently, it has been mostly unknown in child care. Prior to the CWELCC, new child care spaces were located wherever a provider wanted to place them. That has to change now. School boards build schools not where it’s convenient for the principal, but close to where children live. The goal is to provide reasonably similar geographic access to education without overcrowding or lengthy commutes.
In big cities, with lots of kids and historically little child care, the growth in spaces needed is substantial. The City of Calgary would need the largest expansion, almost 23,000 spaces. With almost half of Calgary’s children living in child care deserts, the placement of these new spaces is critical.
The City of Toronto would require over 17,000 new spaces on top of what exists today.
The Cities of Edmonton, Winnipeg, Ottawa and Brampton each require over 10,000 new full-time spaces for children not yet in school to ensure that all their children are lifted to the federal target.
On other hand, cities like North Vancouver, Coquitlam, Oakville or Richmond would only need roughly 600 new full-time spaces each to ensure child care access to the federal target.
Many of the cities in Quebec and P.E.I. would require almost no additional spaces because almost all of their children already have adequate child care spaces within 5 km of where they live.
In a market system, which was how child care was provided in the large provinces outside of Quebec, prior to CWELCC there was no public planning as to where new licensed spaces should go to ensure access. As such, if new spaces were created in child care deserts, it was often by accident. School boards are a public agency that plans for services based on child populations, but they need not be the only public agency that could be provided with planning oversight for child care expansion. Other local public bodies, like municipalities or health authorities, could also be provided a planning mandate.
Such a mandate could include the number of spaces that need to be created, as outlined above, but could also clarify that those spaces be non-profit or public.
Conclusion
As of June 2025, 11 of the provinces and territories have renewed their CWELCC agreements with the federal government for the next five years.19Employment and Social Development Canada, “Toward $10-a-day: An Early Learning and Child Care Backgrounder”, March 6, 2025, https://www.canada.ca/en/employment-social-development/news/2025/03/toward-10-a-day-an-early-learning-and-child-care-backgrounder0.html. Fee reductions of $10 a day (or close to) have largely been implemented.20David Macdonald and Martha Friendly, From Market to Managed: The Uneven Path to $10 a day Child Care, Canadian Centre for Policy Alternatives, July 2025. The lowering of fees has meant a rapid shift in funding sources from predominantly parental fees to now being almost all public money. In other words, child care is now an almost entirely publicly funded system yet it is far from a publicly delivered system. If anything, we are moving further away from public delivery.
The expansion of licensed child care spaces is on pace to meet the raw number of spaces agreed to by most provinces. However, meeting these raw numbers won’t be enough. Several provinces may meet their CWELCC targets but could still be well behind the federal coverage goal of 5.9 licensed spaces per 10 children. Without getting closer to these federal targets, parents will notice that even though fees are lower, they can’t find a space.
Also, the expansion was supposed to be in the non-profit sector, but for the most part, it’s been in the for-profit one—a clear failure so far. Unless steps are taken immediately to organize non-profit or public delivery of new child care spaces, there is no reason to believe the next year of the CWELCC expansion will be any different than the previous four with this being a publicly financed, but for-profit benefit program.
These are the growing pains of a major new national program that has rolled out quickly. Now is clearly a time for readjustment.
The CWELCC extensions for the next five years have been signed by almost all provinces and the detailed action plans are being developed. Now is the time to have the provinces get specific and task lower-level authorities with specific space creation goals. Those lower-level authorities could be city governments, Indigenous governing bodies, school boards, health authorities or other public planning authorities. We should have those lower-level authorities explicitly sign up the exact providers that will receive new licenses, ensuring those providers are non-profit or public. Furthermore, designated expansion facilities should be provided with expedited access to capital funds to build the spaces.
A rapid expansion of this kind can’t be left to providers to initiate, as has been mostly the case so far. If it continues, the CWELCC expansion will be an almost entirely for-profit endeavour. It must be up to provincial governments to take over planning for new child care spaces, although through delegated authority to an existing local public agency. It is only in this way that space expansion can continue to be rapid, public and equitable.
Methodology
Childcare Licensing and Accessibility by Region (CLAR) database
For the past decade, the CCPA has conducted annual child care fee surveys. Each of those begins with provincial and territorial listings of all licensed child care centres and homes. Each province maintains a list of all licensed facilities, with various levels of information. These registries of licensed facilities form the basis for the database.
The goal of the CLAR database is to produce a longitudinal, rapidly updated database of all licensed spaces in Canada tracked at the facility level. This was the information targeted for inclusion for every licensed facility in every province:
- Facility Type: Home or centre
- Detailed counts of spaces by license type (which is often age restricted)
- Facility address, including postal code
- Facility location: Latitude and longitude
- Participation in CWELCC (via the provincial equivalent)
- Other special status, such as $10 a day (B.C.) or pre-kindergarten (Newfoundland and Labrador)
- Facility owner name—goal is to have the ultimate owner/operator even if facilities are owned by numbered corporations
- Whether the owner or operator is a chain and with how many sites
- Ownership type (Auspice)—non-profit, government (municipal or Indigenous), school board or for-profit
- In a public school
Various parts of this data were available from provincial licensing registries, although much were not, which required substantial additional work to properly construct. For instance, owner identification and ownership type (auspice) required months of additional work that involved provincial business registries, along with manually grouping facilities to specific owners based on facility details like common phone numbers, websites, email addresses and/or names.
Postal codes and latitude and longitude were commonly missing, and had to be sought separately.
Table 1 outlines the initial list of registered facilities by provinces. These sources generally provided the address and space counts broken down by the various license types.
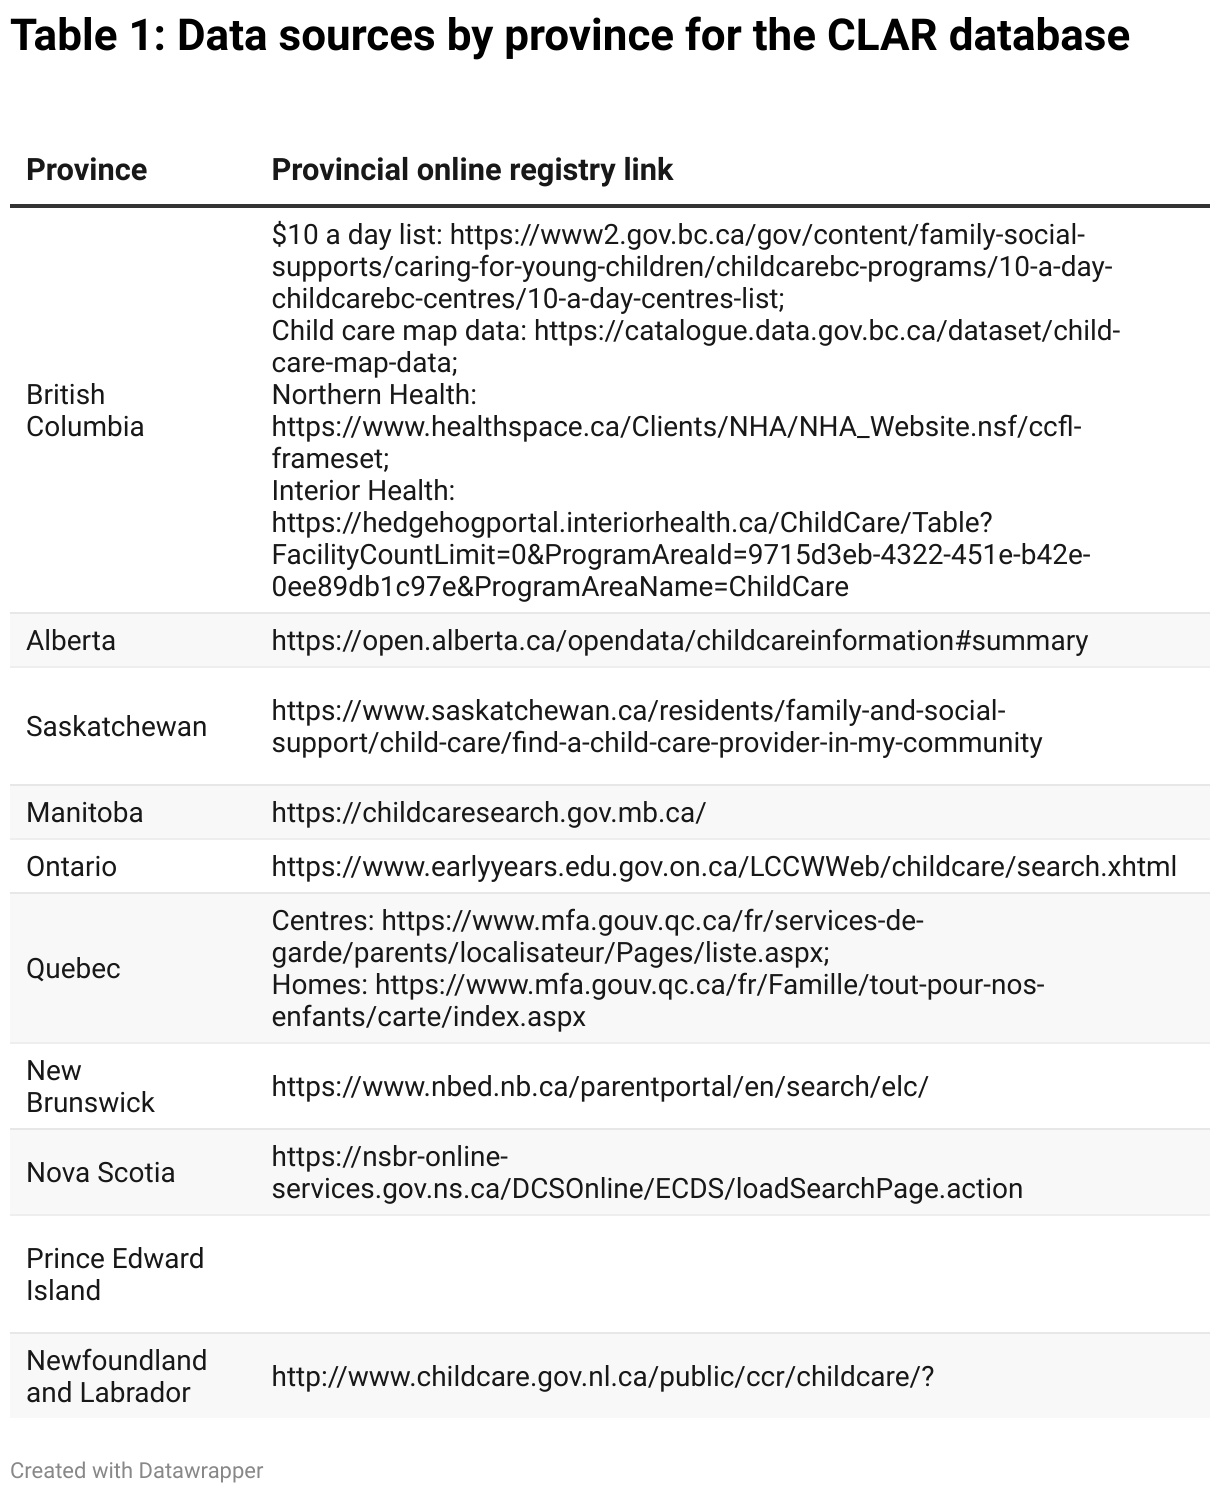
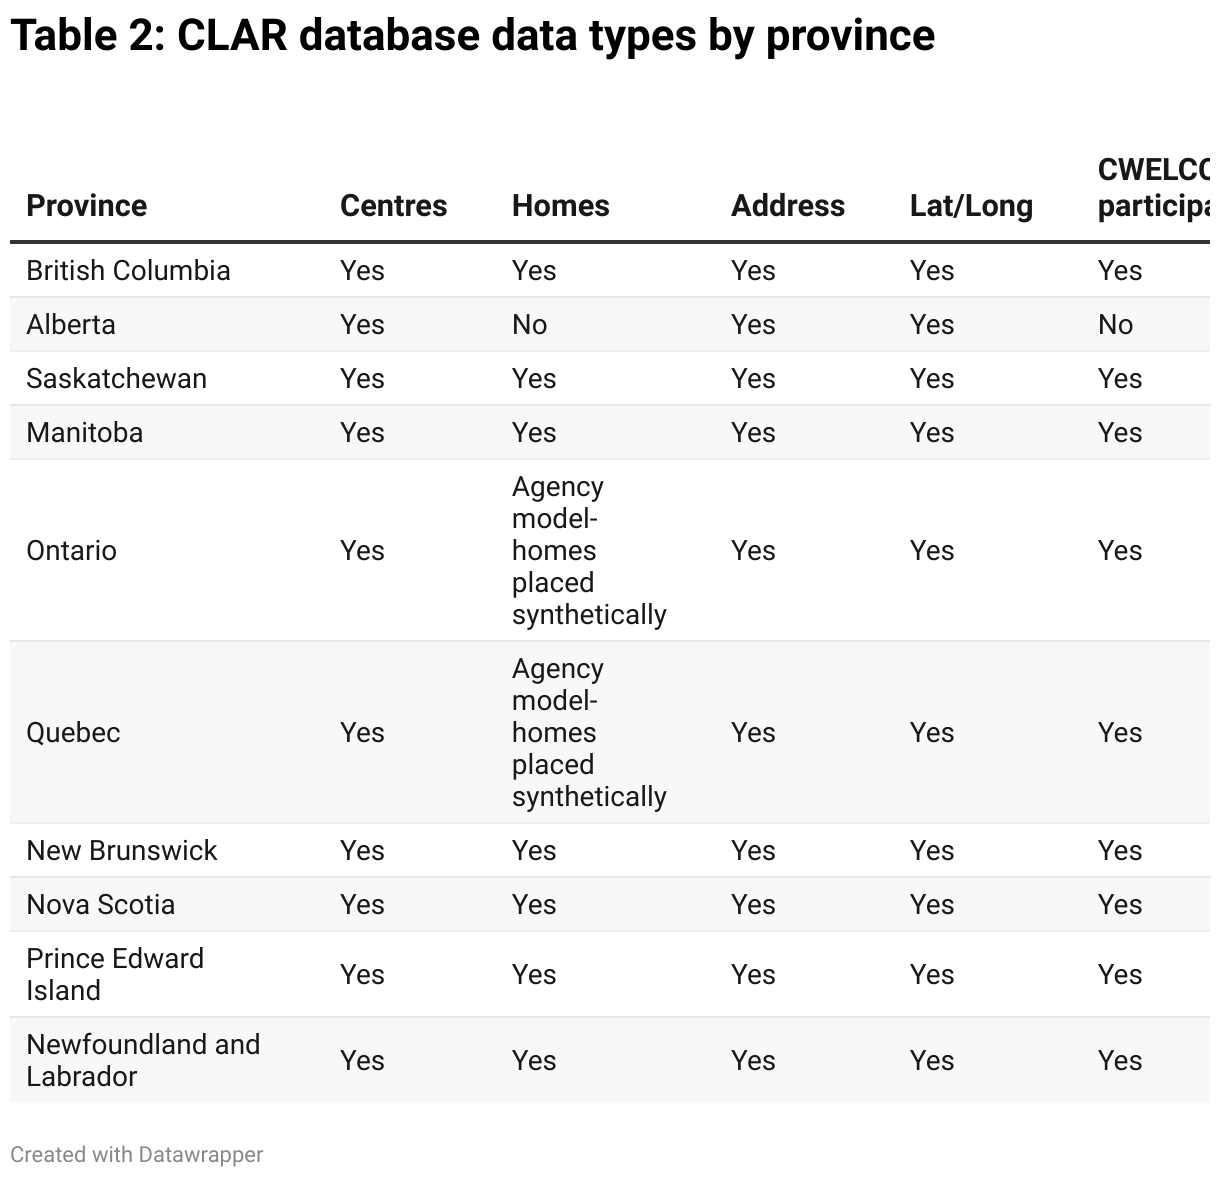
While obtaining the ideal dataset, as set out above, was not universally successful, it was substantially successful. Tables 2 and 3 examine what was obtained and what was missing in terms of data broken down by province. Table 2 examines if particular data characteristics of the facilities themselves were obtained or not. Table 3 examined what was available in terms of the space counts and license types tracked at each facility.
The goals of the CLAR database were mostly successful, particularly for non-school aged licenses. Unfortunately, there remain gaps in the database:
- Counts of active homes in Alberta as well as CWELCC status of centres in Alberta aren’t included in the CLAR database.
- Whether a centre is located in a public school is only sporadically available.
- Ontario and Quebec have active home counts, but they are grouped under agencies that manage those homes instead of revealing the home addresses. Therefore, exact addresses of these facilities aren’t available. However, in Ontario, the city for each home is available. In Quebec, the agencies often have quite specific geographies that they serve. To incorporate homes in Ontario and Quebec, the FSAs where those houses are located is determined. The houses are allocated to each FSA based on the child population. In this way, synthetic homes are assigned specific locations to maintain the overall counts and geographic consistency.
- Homes don’t have defined spaces for each age, as is generally the case for centres. Instead, the maximum children a home can have is dependent on the age makeup of the children. More younger children means fewer children overall. A house with all older children can have more children overall. The actual ages in a house at any time isn’t known. We simply assume four non-school age spaces per home, as an average.
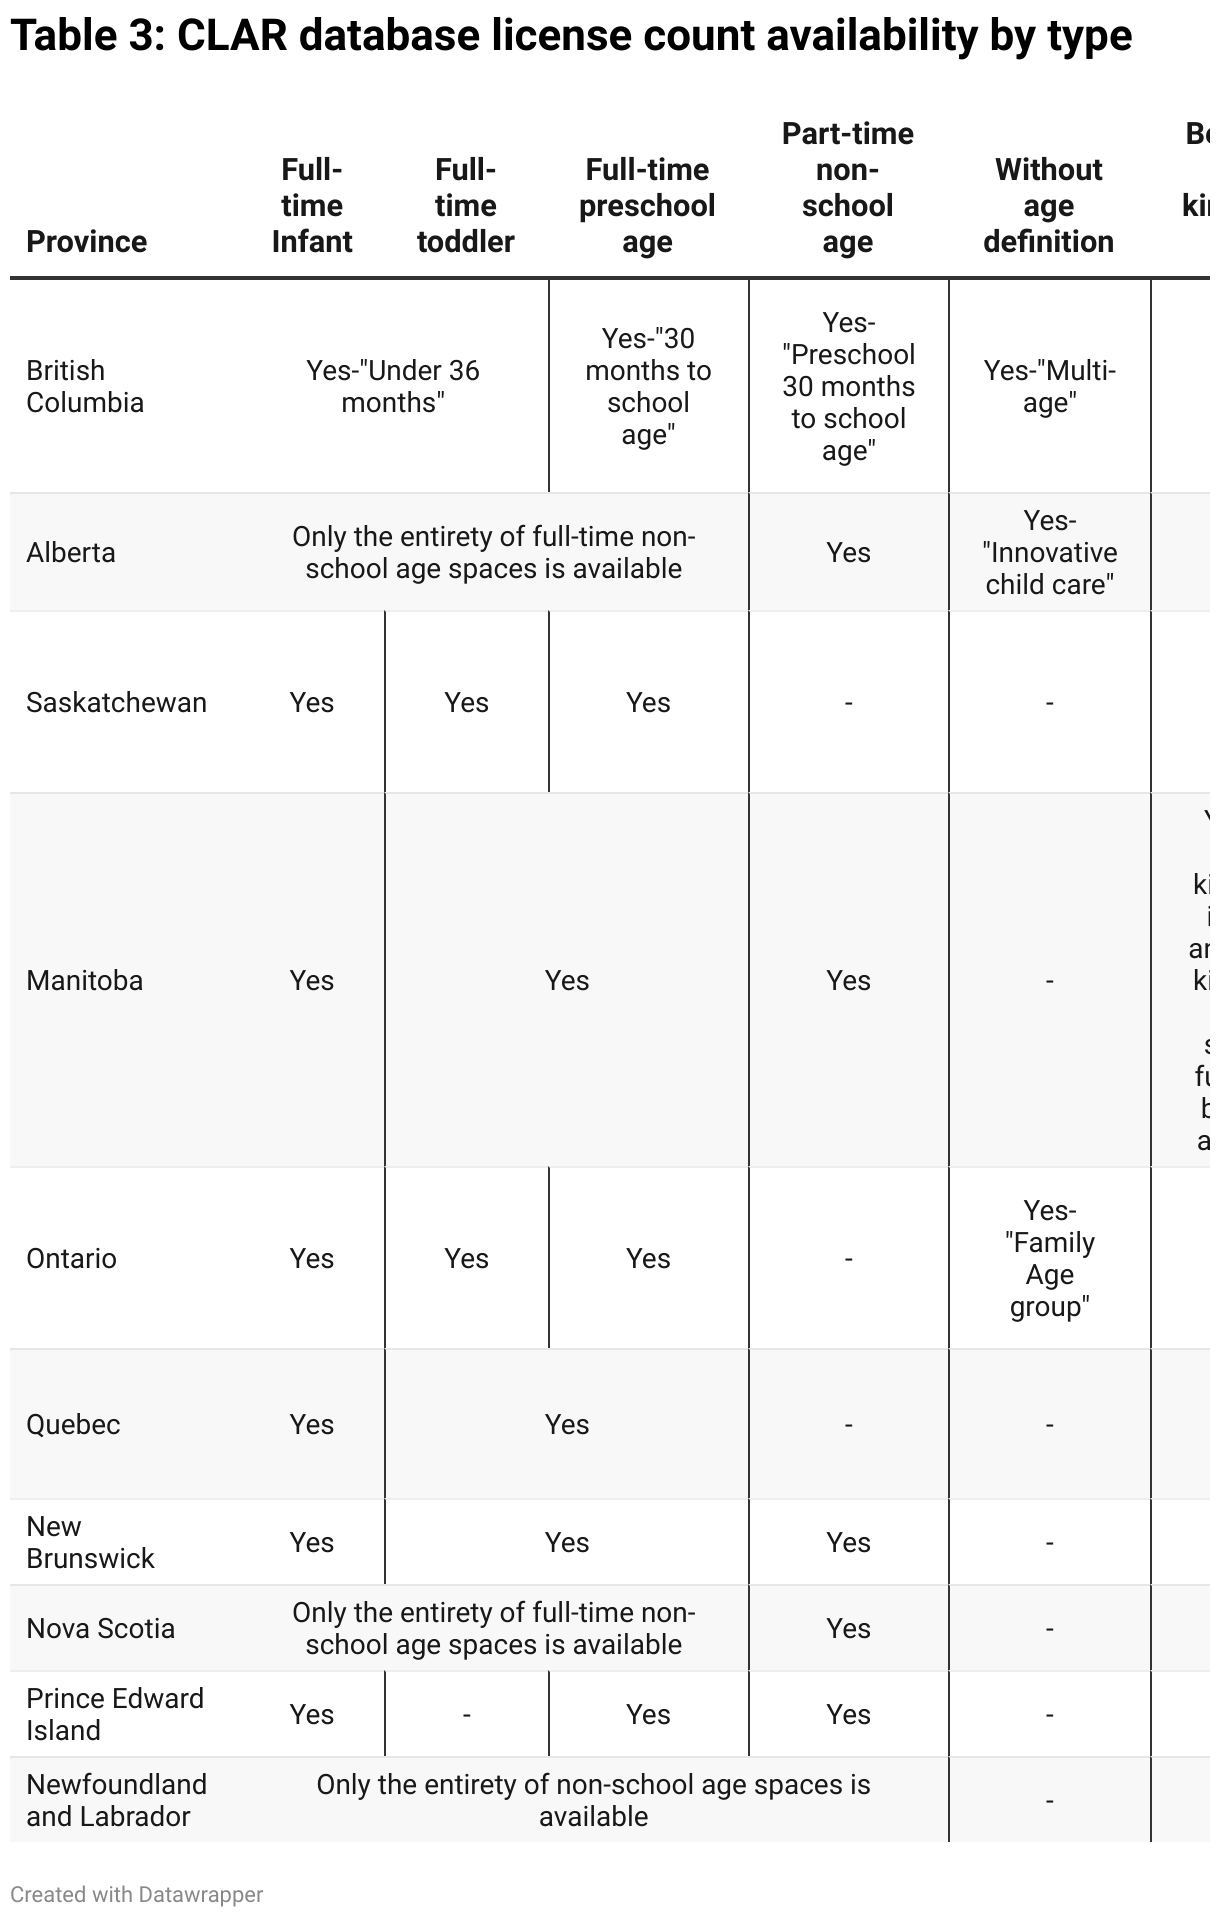
As with the facility characteristics, the CLAR database broadly captures accurate licensed counts by age group. Table 3 shows how the various provincial licensing definitions fit under the generic CLAR classification.
In some provinces, like Nova Scotia and Alberta, we can only determine non-school age license counts without further age detail. For the purposes of this paper, non-school categories are grouped together. As such, not having access to the infant or toddler count within the non-school age count doesn’t affect the conclusions.
In some cases, full-time vs part-time spaces for non-school aged children is available and sometimes it isn’t. In this paper, part-time, non-school age spaces are pro-rated at half a full-time space. This is, by necessity, a rough estimate, and in provinces like British Columbia and Alberta, will likely overestimate the number of adjusted full-time spaces. Part-time programs are sometimes as little as 2.5 hours to three hours per day for only two or three days a week. Even combining two of these part-time spaces would come nowhere near the hours of a full-time space. Unfortunately, better adjustments to convert part-time spaces into full-time equivalents is necessarily imprecise at this time.
In Saskatchewan and Quebec, before- and after-school space counts aren’t available because they aren’t licensed the way other child care spaces are. In this paper, we don’t examine school-age before- and after-school spaces, so this isn’t an issue.
Several provinces have licenses where the ages are specified. As such, these can be used for children of any age. In this paper, we assume they are all going towards non-school age children.
Non-school age definitions by province
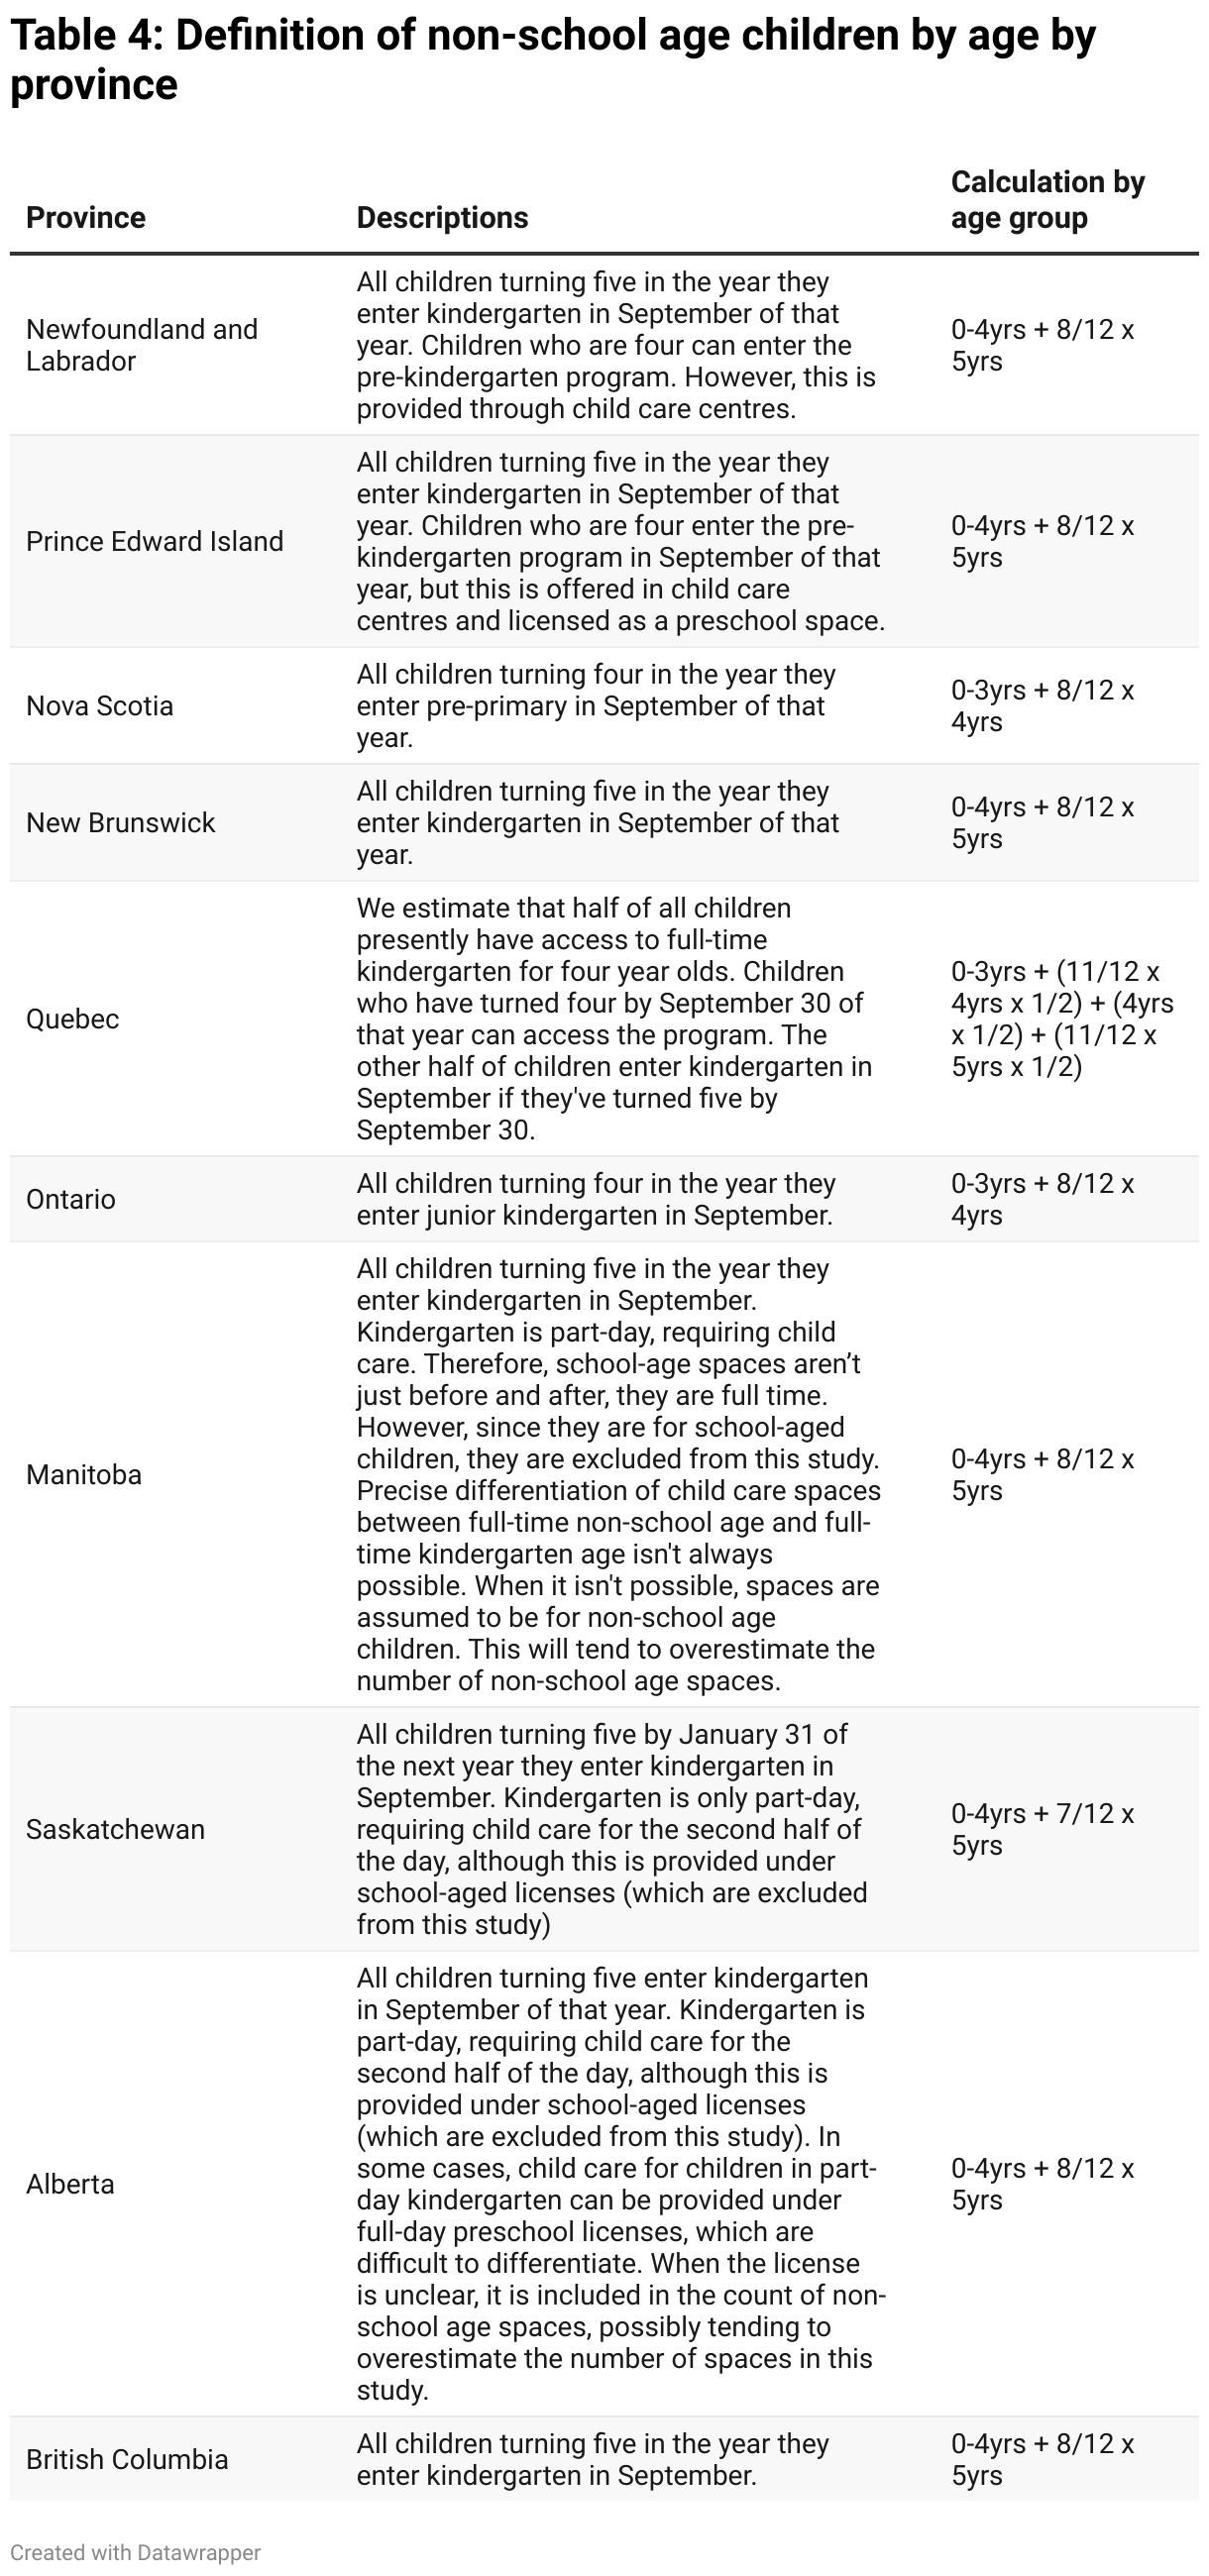
A common and useful breakpoint for child care licensing schemes across the country is whether a child is eligible for public school or not. To make proper comparisons to the child population that could use those spaces, we need to calculate non-school age child counts. The entry ages to public school differ by province. For instance, some provinces have junior kindergarten for four year olds, meaning that fewer non-school age spaces are needed in those provinces.
There is generally a noticeable drop in the need for full-day licensed child care at the start of school in September as a cohort of children enter kindergarten or junior kindergarten—although they’ll likely move to after-school programs, which is another important topic that isn’t examined here.
Even though the need for full-time spaces drops in September with that transition, there is still a need for those spaces for the first eight months of the year, before children go to public school. As such, our estimates include peak potential demand on licensed full-day spaces. Those demands will drop on Labour Day as the cohort for that year enters junior kindergarten and kindergarten programs, accesses before- and after-school spaces and is no longer counted as per our methodology.
Table 4 examines the calculations by province used in this paper to determine how the population of non-school aged children is arrived at, assuming children’s birthdays are evenly distributed throughout the year.
Two step floating catchment area to determine child care access
Traditional accessibility metrics often rely on provider-to-population ratios within fixed boundaries, such as postal codes or census areas.21Mark F. Guagliardo, “Spatial Accessibility of Primary Care: Concepts, Methods and Challenges,” International Journal of Health Geographics 3, no. 3, 2004, https://doi.org/10.1186/1476-072X-3-3. A common child care accessibility measure is the number of available “slots for tots”,22Elizabeth E. Davis, Won F. Lee, and Aaron Sojourner, “Family-Centered Measures of Access to Early Care and Education,” Early Childhood Research Quarterly 47, 472–486, 2019. meaning the total number of child care spaces divided by the number of eligible children in a given area.
While these methods are straightforward, they do not reflect the lived realities on the ground since families often cross administrative boundaries for care that fits their needs. In practice, a child care provider in a neighbouring area may be closer and more accessible than one assigned to a family’s own neighbourhood, highlighting the need for a more nuanced analysis of accessibility.
To capture this reality, Luo and Wang23Wei Luo and Fahui Wang, “Measures of Spatial Accessibility to Health Care in a GIS Environment: Synthesis and a Case Study in the Chicago Region,” Environment and Planning B: Planning and Design, 30, 865–884, 2003. developed the Two-Step Floating Catchment Area (2SFCA) method to measure health care accessibility in Chicago. At its simplest, 2SFCA is a two-step process that incorporates both supply and demand within overlapping service areas.
Researchers have since expanded and modified the 2SFCA approach. Enhanced versions (E2SFCA) incorporate a distance decay function, recognizing that the further away a service is, the less accessible it is.24Wei Luo and Yifan Qi, “An Enhanced Two-Step Floating Catchment Area (E2SFCA) Method for Measuring Spatial Accessibility to Primary Care Physicians,” Health & Place, 15, no. 4, 1100–1107, 2009, https://doi.org/10.1016/j.healthplace.2009.06.002. Similarly, it’s not just “as the crow flies” distance that can be accounted for with modifications but also the time,25Dajun Dai and Fahui Wang, “Geographic Disparities in Accessibility to Food Stores in Southwest Mississippi,” Environment and Planning B: Planning and Design, 38, 659–677, 2011. cost burden and variations in mode of travel, such as using public transit, can be included.26DeBaryshe et al., “Close to Home: Family-Centered Spatial Analysis of Access to Early Care and Education,” 2024.
The method originally gained popularity in health care,27Guagliardo, “Spatial Accessibility of Primary Care: Concepts, Methods and Challenges,” 2004; Luo and Wang, “Measures of Spatial Accessibility to Health Care in a GIS Environment: Synthesis and a Case Study in the Chicago Region,” 2003. but has since been used to measure access for food security28Dai and Wang, “Geographic Disparities in Accessibility to Food Stores in Southwest Mississippi,” 2011. and seniors’ care.29Sunwei Liu, Yupeng Wang, Dian Zhou, and Yitong Kang, “Two-Step Floating Catchment Area Model-Based Evaluation of Community Care Facilities’ Spatial Accessibility in Xi’an, China,” International Journal of Environmental Research and Public Health 17, no. 14, 5086, 2020, https://doi.org/10.3390/ijerph17145086. Researchers have only just begun using these kinds of methods to look at how families access child care. In Belgium, Fransen et al. (2015) introduced a commuter-based 2SFCA method to measure child care accessibility.30Koos Fransen, Tijs Neutens, Philippe De Maeyer, and Greet Deruyter, “A Commuter-Based Two-Step Floating Catchment Area Method for Measuring Spatial Accessibility of Daycare Centers,” Health & Place, 32, 65–73, 2015. In the U.S., Davis, Lee and Sojourner (2019) developed a family-centered, distance based 2SFCA model that incorporates supply, cost, quality and time.31Davis, Lee, and Sojourner, “Family-Centered Measures of Access to Early Care and Education,” 2019. More recently, Blumenberg, Yao and Wander (2023) applied a modified 2SFCA approach in California, integrating demographic indicators like race, income and employment to explore spatial inequities.32Evelyn Blumenberg, Zhiyuan Yao, and Madeline Wander, “Variation in Child Care Access Across Neighborhood Types: A Two-Step Floating Catchment Area (2SFCA) Approach,” Applied Geography, 158, 103054, September 2023. Building on prior work, DeBaryshe et al. (2024) extended the model in Hawaii by incorporating ethnic composition, affordability and provider characteristics.33Barbara D. DeBaryshe, Seongah Im, Javzandulam Azuma, Ivette Stern, Minh Nguyen, and Qi Chen, “Close to Home: Family-Centered Spatial Analysis of Access to Early Care and Education,” Early Childhood Research Quarterly, 68, 123–134, 2024.
Despite its recent growing prominence globally, the 2SFCA method has seen limited use in Canada,34André Ngamini Ngui and Philippe Apparicio, “Optimizing the Two-Step Floating Catchment Area Method for Measuring Spatial Accessibility to Medical Clinics in Montreal,” BMC Health Services Research 11,166, 2011, http://www.biomedcentral.com/1472-6963/11/166 . and none of it in relation to child care access.
The following is the description of the two-step floating catchment area method as applied in this paper. The basic data points are all child care facilities in Canada, for which we are tracking almost 42,000, and all dissemination areas (roughly a city block or two) with children, of which there are over 55,000.
Step 1:
Where
Rf = Supply to demand ratio at child care facility f
Sf = Number of non-school age spaces at the child care facility f
Cd = Number of non-school age children in Dissemination Area (DA)d
Catchment(f) = set of all DAs within the same province and within 5 km of facility f, except in rural areas where 10 km radius is used
Step 2:
Where
Ad = Accessibility score for DAd
Rf = ratio computed in step 1 for facility f
Catchment(d) = set of facilities in the same province and within 5 km of the DA d, except in rural areas where within 10 km of the DAd
The accessibility score calculated in step 2 for each DA is essentially a coverage rate but adjusted for overlapping demand. The DAs are a very low level of geography, encompassing a street or two in suburban areas or a single apartment building in downtowns. DAs are built up from Dissemination Blocks, which have even smaller footprints. While Dissemination Blocks (DB) do have published populations and dwelling counts, no other census variables are available at that level. Most importantly, DBs don’t have child population figures. Therefore, Dissemination Areas are the lowest census geography possible for our purposes.
DAs have a latitude and longitude centroid that is population weighted. The population weighting is relatively unimportant in populated areas, as the DAs themselves are so small. The centroid location within the DA becomes more important in more rural areas, where DAs are geographically larger and a population may be in a village, for example, which will pull the centroid onto itself. In large rural DAs with sparse populations, that centroid may no longer reasonably represent where the population is. In this analysis, any DA that exceeds 200 km2 (for example a circle of diameter 16 km or a rectangle of 20 km by 10 km) is excluded.
Figure 13 shows the scale of a DA in a suburban part of Burnaby, B.C. It contains several suburban blocks containing 118 houses. The children in DA 59150269 had a coverage rate of 23 per cent in 2022, which improved somewhat to 26 per cent in the first quarter of 2025. Every single shape in Figure 13 has a separately calculated coverage rate based on the child care facilities within 5 km of the centroid of each. There were 322 DAs in the City of Burnaby alone.
In our dataset, there are just over 55,640 DAs with data; 1,779 are excluded due to being over 200 km, leaving us with just under 53,861 DAs with a valid child care coverage rate.
Throughout the report, higher levels of geography are used, but these are aggregations of the DAs using counts or child-weighted averages.
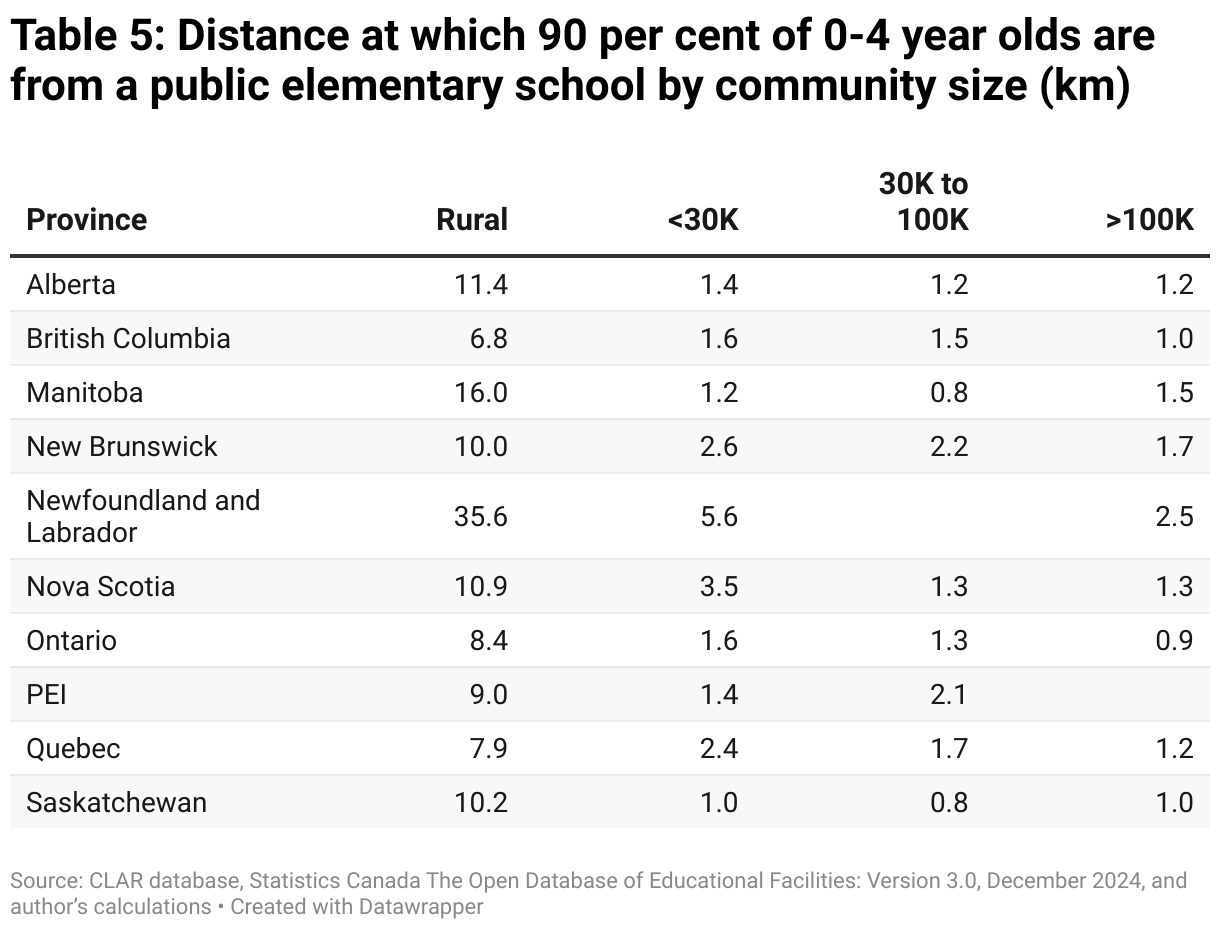
Table 5 calculates the distance within which 90 per cent of children aged four and under live from a public elementary school. It shows that for any populated centre whether a small town with under 30,000 people or big city of over 100,000 people, the distance at the 90th percentile is at most a kilometre or two. For instance, 90 per cent of children aged four and under in a big city in Ontario live within 900m (0.9 km) of a public elementary school. The two step floating catchment area methodology uses a much larger 5 km radius easily capturing option for parents dropping off kids on the way to work.
In rural areas, 90 per cent of children aged four and under live within roughly 10 km of a public elementary school. If we envision child care accessibility being similar to public elementary accessibility, the urban radius is larger than it likely needs to be. The rural radius is roughly where it should be, although its significantly larger in than 10 km in Newfoundland and Labrador and Manitoba. Child care facilities can be much smaller the elementary schools, down to the size of a single house. If anything, child care facilities can be more distributed and therefore closer to where children live than elementary schools.
Estimating child population growth and census net undercounts at the DA level
The child populations of each DAs are available from the census for May 2021. However, there are further population estimates at the DA levels past 2021.
There are three relatively low levels of population updates available from 2021 through 2024: the Census Municipal Areas and Census Agglomerations (CMA/CA) level estimates,35Statistics Canada, Table 17-10-0148-01, Population estimates, July 1, by census metropolitan area and census agglomeration, 2021 boundaries. Census Subdivision (CSD) level estimates36Statistics Canada, Table 17-10-0155-01, Population estimates, July 1, by census subdivision, 2021 boundaries. and Census Division (CD) level estimates.37Statistics Canada, Table 17-10-0152-01, Population estimates, July 1, by census division, 2021 boundaries. Unfortunately, the CSD estimates don’t include child populations. Although there are more CDs than CMAs, they often combine urban and rural areas, which may have substantially different population growth rates. As such, CMAs were chosen to grow DA level child populations.
Annual growth rates were broken down by quarter with the July 1 published data being the data for the second quarter. Separate growth rates for children four and under and five to nine were calculated. The 2025 second quarter data wasn’t available at the time of this publication. As such, the 2025 growth rate was calculated using straight line estimates of CMA growth by age group over the previous five years. The child populations of all DAs in the CMA were grown at the same rates.
The DA populations were initially from the census and needed to be adjusted for net census undercounts.38For more on the census undercounts see Table 1: Statistics Canada, Annual Demographic Estimates: Subprovincial Areas, July 1, 2024, https://www150.statcan.gc.ca/n1/pub/91-214-x/91-214-x2025001-eng.pdf. First, incompletely enumerated First Nations settlements and reserves are adjusted for at the CMA level, although most are outside of named CAs/CMAs. Next, CMA level census counts were compared with July 1, 2021 population estimates39Ibid at the CMA level. Any census net undercounts were incorporated into the CMA growth factors calculated above. As such, child populations in this report should be comparable to the July 1 population estimates.
Statistics Canada does project provincial level child counts for 2025 and those were available at the time of publication. If we aggregate up our estimated child populations in 2025 to the provincial level, we get error rates of under 2.3 per cent for children aged four and under and less than 3.3 per cent for children aged five to nine compared to the M1 medium-growth population projections for the provinces.40Statistics Canada, Table 17-10-0057-01, Projected population, by projection scenario, age and gender, as of July 1 (x 1,000).
Note that changes in the child care accessibility ratios can be due to both changes in spaces available but also changes in the child population in that DA, due to growth rates or the growth rates of any other DA that may overlap on the nearby child care facilities.
Acknowledgements
The author would like to thank the following people for their thoughtful comments on an earlier draft of this paper: Lynell Anderson, Carolina Aragão, Morna Ballantyne, Jane Beach, Simon Enoch, Martha Friendly, Ariane Hotte, Molly McCracken, Yolande Pottie-Sherman, Susan Prentice, Eric Swanson and Ricardo Tranjan.
About the author

David Macdonald
David joined the CCPA as its Senior Ottawa Economist in 2011, although he has been a long time contributor as a research associate. Since 2008, he has coordinated the Alternative Federal Budget, which takes a fresh look at the federal budget from a progressive perspective. David has also written on a variety of topics, from child care to income inequality to federal fiscal policy. He is a regular media commentator on national policy issues, often speaking to the CBC, Globe and Mail, Toronto Star and Canadian Press. David received his BA from the University of Windsor and his MA from the University of Guelph, both in Philosophy. Follow David on Bluesky at @davidmaccdn.bsky.social