Debt across the Canadian economy
Whenever the federal government’s budget is discussed, the focus quickly turns to the deficit and debt. The discussion of government debt is rarely considered in the context of debt in all segments of the Canadian economy. Other sectors of Canada’s economy continually have substantial debt that rarely goes down. Individual people and individual businesses take out debt and then pay it off over time. At the sector level, debt is almost always increasing, but so are assets. This is due to economic and population growth.
Debt is the counterpart of the creation of asset value. If no one can obtain a loan to purchase an asset, particularly a very expensive asset like a house, then the transaction can’t take place and the asset’s value cannot be converted into cash. If you can’t transact an asset, then its value is in serious doubt and large assets are rarely, if ever, purchased in cash—they are almost always purchased with debt.
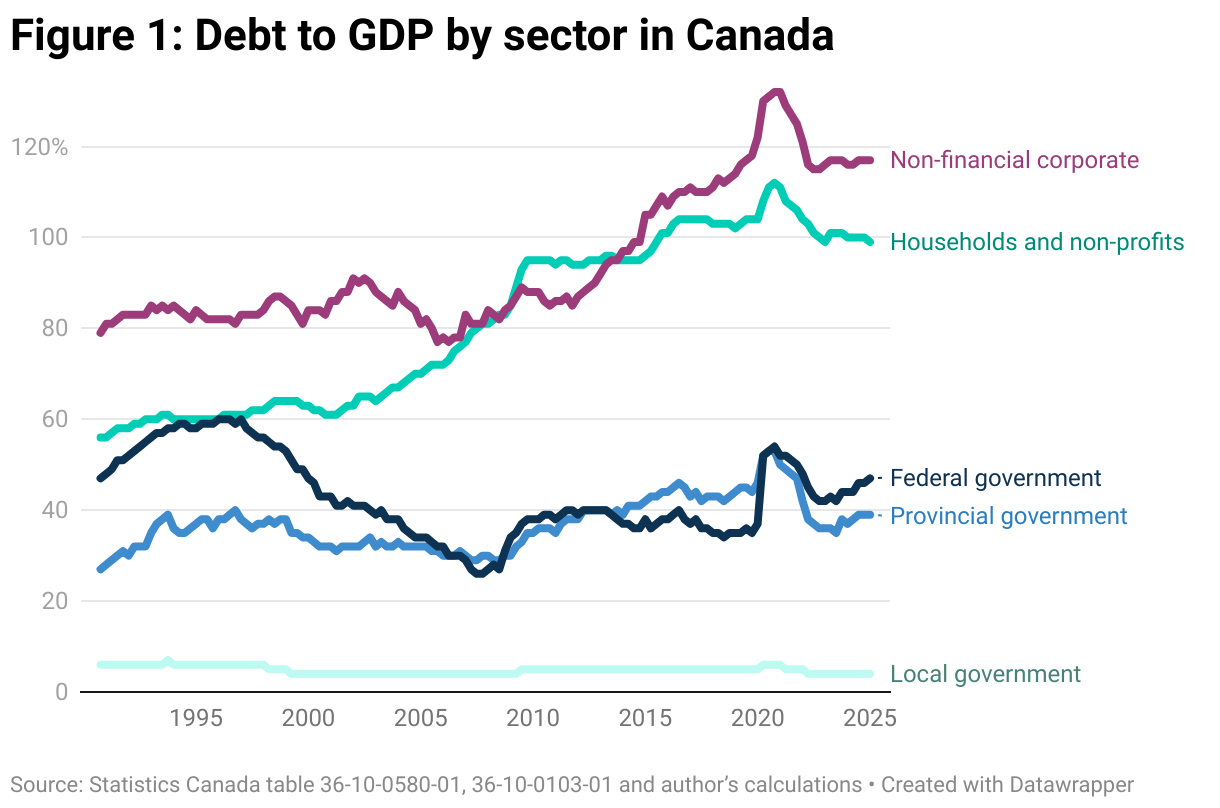
With that in mind, let’s look at all sectors of the Canadian economy and their debt levels relative to GDP, in Figure 1. In this context, local government debt is the lowest. Most municipal governments carry little, if any debt, often because provincial legislation doesn’t allow it.
Provincial and federal government debt is also relatively small compared to other sectors in Canada. Since the pandemic, the federal government holds slightly more debt than the provinces. This is as it should be because federal bond rates are lower, making interest costs more affordable.
Household and corporate debt are much higher: essentially double the level of the federal government’s. Federal debt has come down as a percentage of GDP since the 1990s, but household debt increased substantially from 2000 to 2009. Corporate debt for rose substantially starting in 2011 and has stayed higher ever since.
What is common across all sectors is the uptick, and then reversal, in debt to GDP during the pandemic. Debt rose as the economy shut down during COVID-19. This hit governments particularly hard as they dealt with major health and economic impacts. It also hit corporate profits, leading to higher debt. However, the debt load rapidly fell in all sectors during the re-opening of the economy; high nominal GDP growth cut its relative value. The debt didn’t go away, but a larger economy made it easier to pay down.
The real concern isn’t government debt, it should be household debt and, to some extent, debt in the corporate sector. The typical answer is to provide them with tax cuts, but this would produce a larger federal deficit, exactly matched by a larger surplus on the receiving end of the tax cut. This just moves debt around, creating higher federal and provincial debt and lower household debt, for example.
The rapid reduction in debt to GDP in 2020 through 2022 gives us another path: higher nominal GDP growth. Debt in the household sector is mostly mortgage debt. Strong wage growth and more affordable housing is a path to lower household debt—if you’re concerned about debt, affordable housing is where the focus should be. These are certainly areas that the AFB would act to address debt, particularly in the housing chapter.
Rapid nominal GDP growth was part of the reason why corporate debt to GDP came down, but another part of the story was that corporate profits soared during the economic re-opening. Actual dollar profits are well above pre-pandemic levels, but so are profit margins.
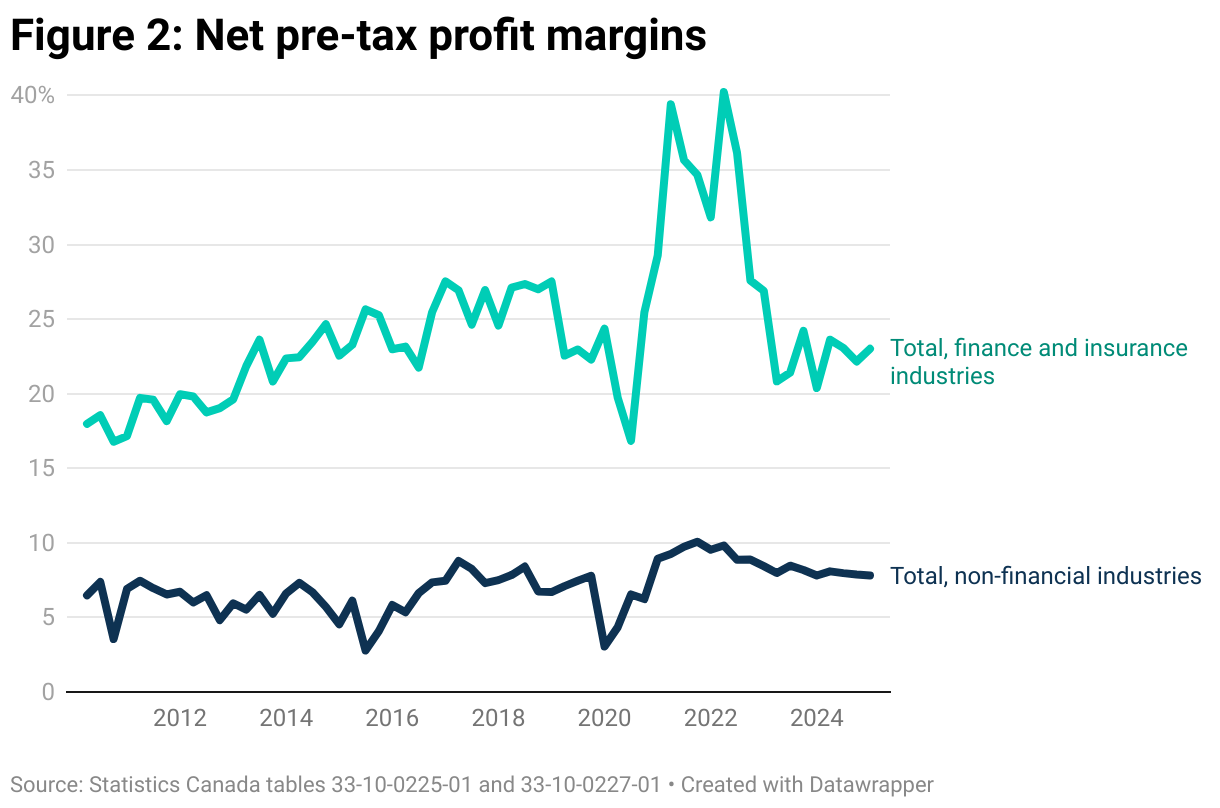
Pre-tax profit margins hit historic highs in the years following the pandemic, as shown in Figure 2. These far higher margins happened in both the financial and non-financial sectors.
While the financial sector profit margins are now back to pre-pandemic levels, in the 20 per cent to 25 per cent range, non-financial margins are not. They are still well above pre-pandemic norms, eight per cent would have been considered a record margin prior to the 2021-23 boom, but now it is seemingly the norm.
At this point, non-financial margins do seem to be slowly coming down after a period of extended high profits. It bears remembering that there were beneficiaries of high inflation long after the initial price increases. Corporate profits in the non-financial sector took advantage of higher prices by converting them to sustained higher-profit margins.
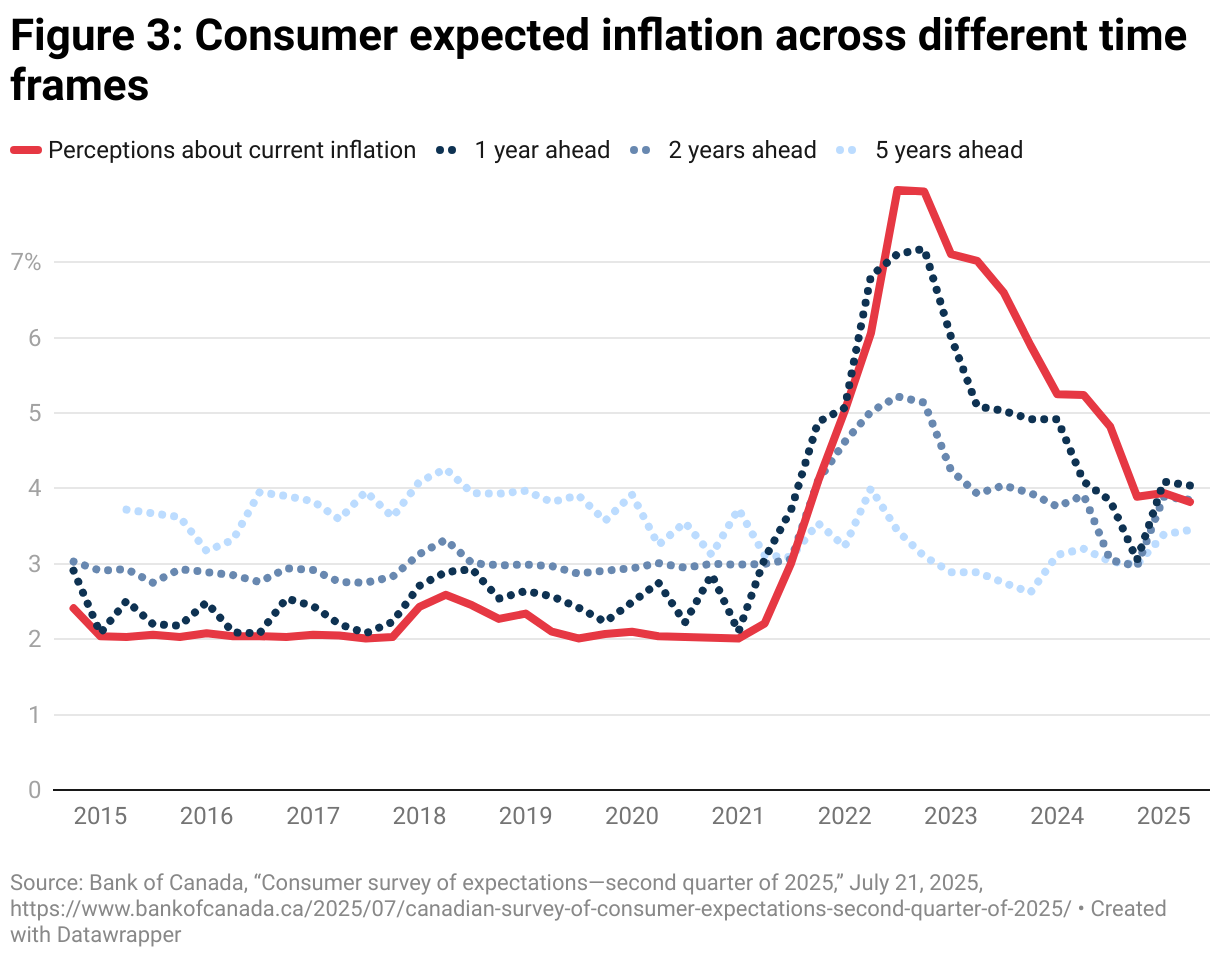
The new threat of tariffs could easily set the conditions for another round of corporate profiteering. At this point, there is plenty of confusion among consumers about the actual level of tariffs on goods entering Canada. Right now, their practical impact is quite low. At the same time, the inflation expectations of consumers, across multiple time frames, remain elevated. Particularly on shorter-term time frames, consumers are primed and expect to pay more, roughly double what the current inflation rate. Consumers see tariffs as a valid excuse for higher prices, according to a Bank of Canada survey. Without guardrails on corporate behaviour, we could easily see a repeat of the inflation-profit spiral Canada experienced in 2021-22.
Inflation isn’t a force of nature—it’s the result of decisions made by the corporate sector to raise their prices. We need to be better prepared for future price surges. We need excess profits taxes (see the Taxation chapter) to disincentivize corporations from doing this again. We need to also better understand key inputs into the Canadian economy that can drive prices up along the entire supply chain. These interconnections of key inputs to other goods production are poorly understood. With a better understanding, we could produce better price regulation to avoid rapid price increases. We could also consider strategic reserves as a buffering stock to guard against inflation in key inputs and, therefore, better protect the economy.
Federal capital and operating budgets
The federal government is focused on balancing the operating budget as a substitute for balancing the budget generally while running a capital deficit. It’s worth examining what this might mean through the AFB lens.
The federal budget already adjusts for capital expenditures through accrual accounting. If the government purchases or builds an asset, like a bridge, the cost of building that bridge is accrued over the life of the asset (30 to 50 years for a bridge).
The trouble for the federal government is that much of its spending is transfers to other levels of government that end up owning the assets that federal transfers may have built. A municipality builds the bridge, with federal help, then owns it. A transfer from the federal government to another level of government cannot be accrued over an asset’s life span in the same way; it shows up as cash in a federal budget.
This year, the AFB has experimented with an Accrual+ structure. Capital owned by the federal government, in addition to repayable loans it makes to build infrastructure, are accrued over the useful life of the asset, as has always been the case. However, the AFB is also tracking transfers to other levels of government that will be used to build assets. We can look at capital spending on a cash basis while separating capital under Accrual+ versus operating expenditures. In the AFB, 41 to 50 per cent of cash spending is on capital, depending on the year examined. Roughly half of the programs will result in the creation of new assets.
Simply subtracting total federal revenues from federal operating expenses would produce an operating surplus. One might then say the aggregate deficit is caused by capital investments, which have returns. But the total increase in debt and debt to GDP will be the same.
Bottom line: there is an artificial distinction between capital and operating expenses. We also need to be careful in introducing moral implications to accounting identities: capital deficits are good, operating deficits are bad. Both capital and operating spending are needed for high-quality public services. Hospitals without staff are just as bad as staff without a hospital.
Capital doesn’t exist without operating spending and vice versa. If you just build buildings, but don’t maintain them with operating funding, then they rapidly degrade. Capital doesn’t provide services on its own.
In the challenge of maintaining high-quality public services, a particular service may sometimes need capital and/or operating funding. There will be different needs in different sectors. If you have a problem with staff retention, a new hospital (capital) won’t help, but higher wages (operating) might.
There is also the viewpoint that capital spending is an “investment” that provides a return (justifying a deficit), whereas operating spending has no return and, therefore, should be balanced. But operating expenditures can easily provide a long-term return on investment. If a health care intervention allows someone to return to work, there is a clear return to that person, the economy and government revenues. If that intervention was early in life, the returns could be over a lifetime.
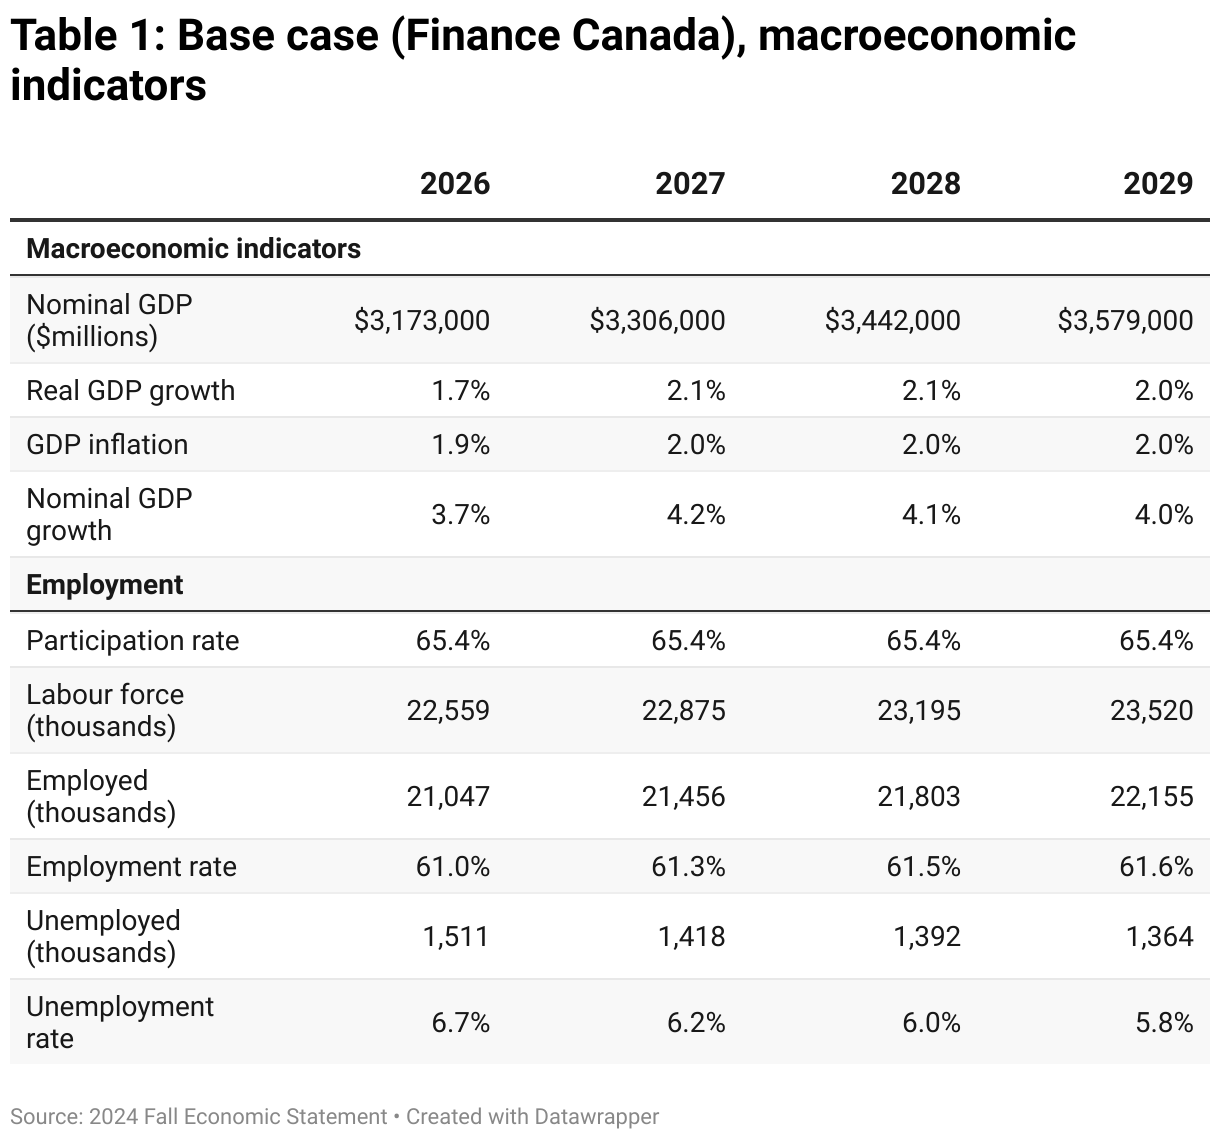
AFB macroeconomic baseline
The AFB starts with the most recent projections from Finance Canada—the Fall Economic Statement released in December 2024. Upon that baseline, it builds its programs so that differences in the AFB and the federal budget are due to differences in programs and not differences in economic growth projections.
Due to trade uncertainty, the federal government skipped its spring 2025 budget. The March 2025 Parliamentary Budget Office (PBO) deficit projections that were created for federal election costing are the most recent estimates of the federal deficit.1Jill Gisold et al., “2025 Election Proposal Costing Baseline”, Office of the Parliamentary Budget Officer, March 24, 2025, https://www.pbo-dpb.ca/en/additional-analyses–analyses-complementaires/BLOG-2425-011–2025-election-proposal-costing-baseline–cout-mesures-proposees-pendant-campagne-electorale-2025-prevision-reference. The PBO estimates the deficit at $33 billion for 2026-27 and 2027-28 and $29 billion in 2028-29. For 2026-27, this is $2 billion larger than the 2024 Fall Economic Statement, $3 billion more in 2027-28 and $1 billion more in 2028-29. However, detailed estimates of expenditures and revenues weren’t included in the PBO projections.
The Bank of Canada Monetary Policy Report of July 20252Bank of Canada, “Monetary Policy Report – July 2025,” July 30, 2025, https://www.bankofcanada.ca/publications/mpr/ . forecasts real GDP as 1.4 per cent in 2026 and 1.1 per cent in 2027. This is 0.6 per cent lower in 2026 and 0.3 per cent lower in 2027 compared to the baseline the AFB is using.
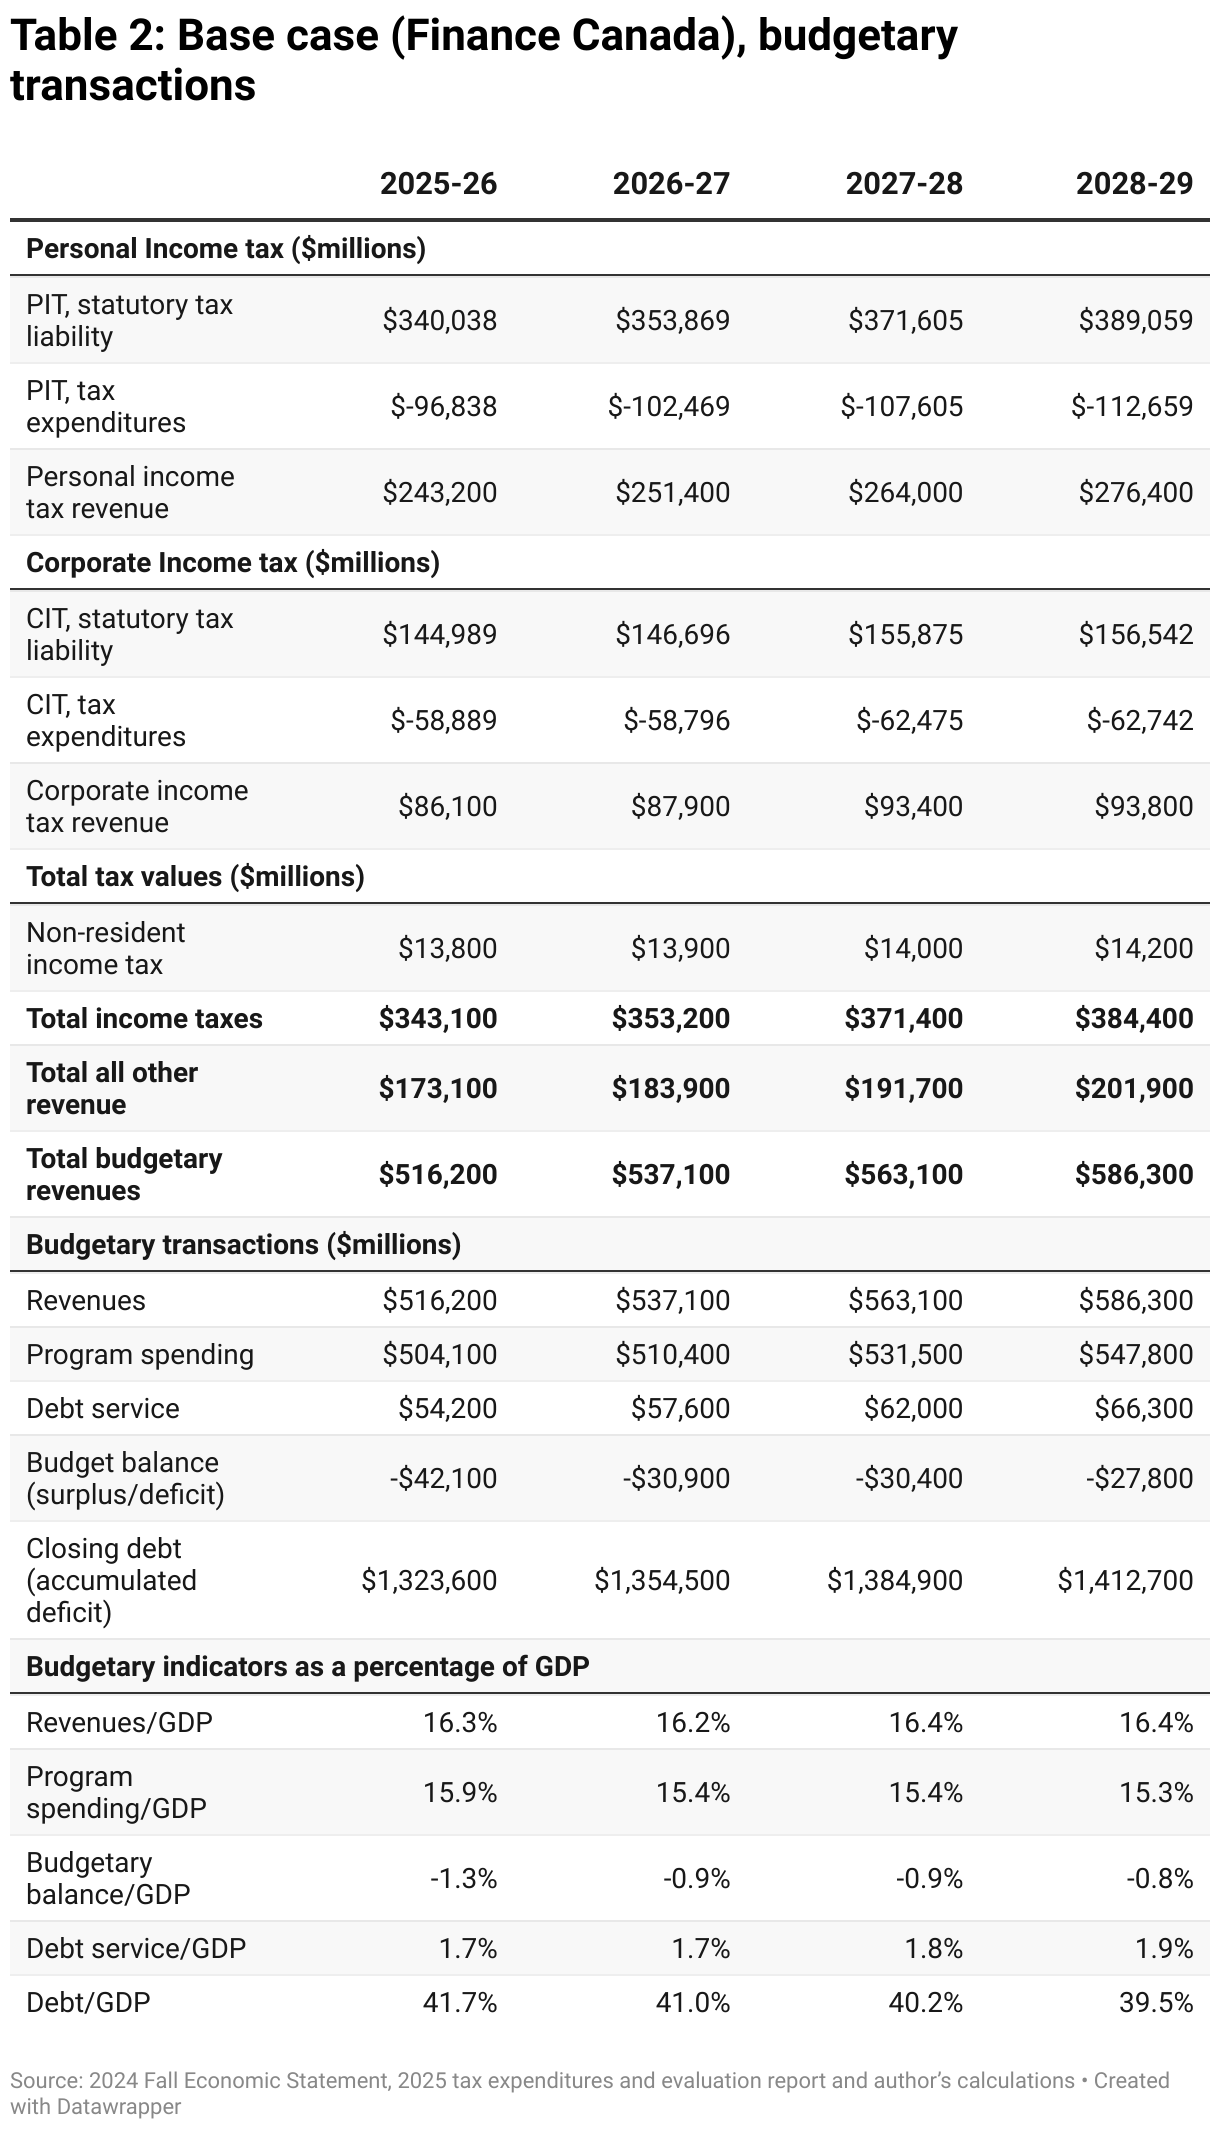
In contrast to previous AFBs, this year we’re including an expanded projection of personal and corporation income taxes. In a first, we’re including the statutory tax liability in both tax categories. This is the tax that would have been collected without exceptions to the basic statutory tax system. In other words, if all tax credits, tax exemptions, tax breaks, tax refunds, etc. were removed, we calculate what would be collected.
The total of those exemptions is summarized in the “tax expenditures” line for both systems. The total on the third line is the amount that is projected to be collected through these taxes.
Roughly $100 billion in personal income taxes is given up in tax breaks or tax expenditures. This has never been recorded anywhere as a cost before in a budget statement. It is one of the largest single expenditures categories the federal government makes. It is larger than provincial health transfers, larger than transfers to seniors or for children’s programs. The personal income tax system gives back three out of every 10 dollars it could have collected in tax expenditures.
The corporate income tax system gives back roughly $90 billion a year in tax expenditures—roughly four out of every 10 dollars collected from corporations that is immediately given back through various tax credits and exemptions.
The AFB closes several of these tax expenditures in its taxation chapter, trimming these massive expenditures so their proceeds can be better spent elsewhere.
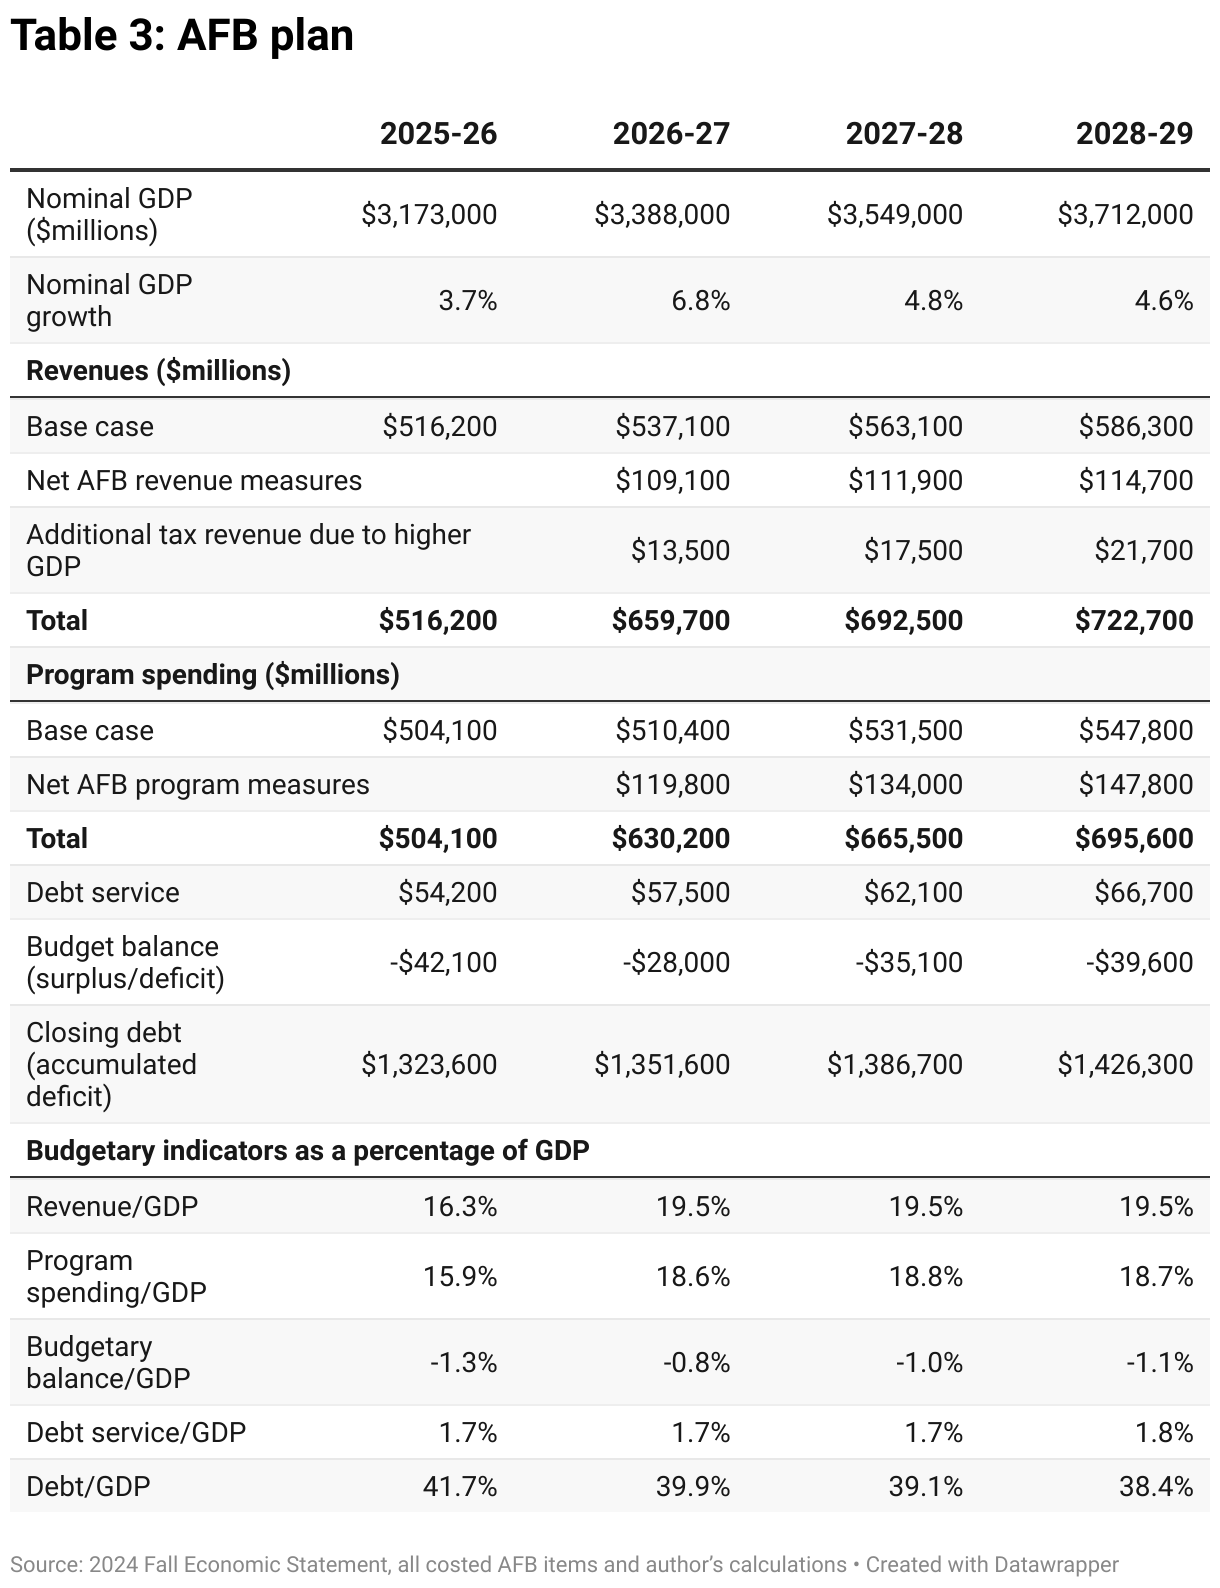
The AFB has important economic and employment impacts. Unlike the base case, which accepts meagre growth, the AFB kicks growth into high gear. Many of Canada’s planned capital projects, particularly housing capital projects, would be owned by the federal government. Some would be initiated by federal loans that would be paid back, keeping the costs recorded in a federal budget low. The capital cost is spread over a project’s lifetime, but there would be a spurt of construction along with the GDP and employment growth that comes with it. Extra economic activity would also bring in new tax revenue, which is accounted for by assigning all AFB measures a multiplier type, both positive and negative, and aggregating them in Table 3.
The AFB, in the aggregate, expands both expenditures and revenues by roughly $100 billion a year. As a result, there are very little changes to the AFB baseline deficit. The AFB pays for new spending with cuts elsewhere, as well as new revenue sources. The AFB’s new programs create a bigger economic impact. Wealth, corporate income taxes and tax dodging, whose economic multipliers are low, are used to provide better child care, First Nations’ services and support for low-income Canadians, whose economic multipliers are high.
The AFB maintains a deficit worth roughly one per cent of GDP, however, its focus on Canadian growth yields a falling debt-to-GDP ratio, which drops from 42 per cent down to 38 per cent. This relative reduction was due to rapid nominal GDP growth, as happened following the pandemic fallout and that’s the device the AFB is employing here.
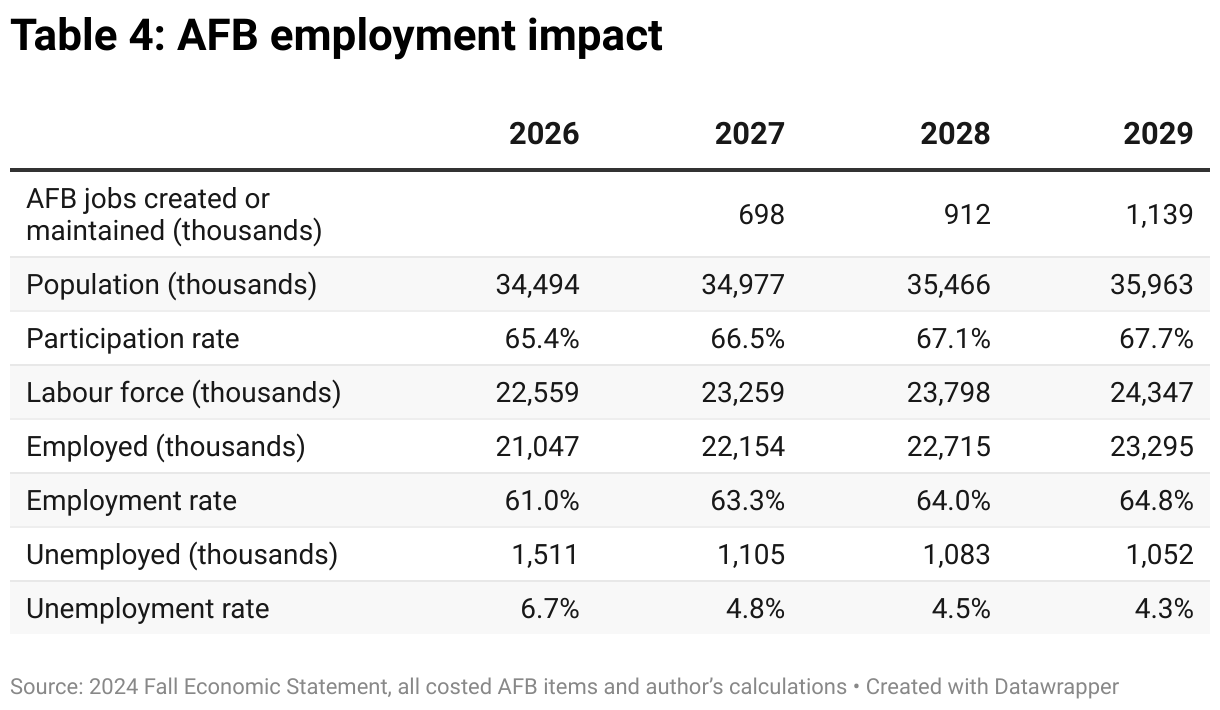
The benefits of the AFB aren’t only counted in GDP statistics—they would result in important job creation, as shown in Table 4. By its third year, the AFB would add an additional million jobs. The result would be lower unemployment, stronger wage growth and a better deal for workers.
The result for businesses would be to push them to invest in workers in order to retain them. This would come in the form of investments in technology as well as better workplace training, resulting in more productive workers. More jobs at higher wages are also a poverty alleviation strategy. Combined with strong income supports (see the Poverty and income security chapter) the AFB creates more opportunities for earned income at higher hourly rates for those who can work.
Income distribution of the AFB measures
All direct personal taxes and transfer changes in the AFB are modelled in Statistics Canada’s tax modelling software.3This analysis is based on Statistics Canada’s Social Policy Simulation Database and Model 30.3. The assumptions and calculations underlying the simulation were prepared by David Macdonald and the responsibility for the use and interpretation of these data is entirely that of the author. These occur in the chapters on taxation, Employment Insurance and poverty and income security. This allows us to look at the distribution of direct benefit or cost by economic family income decile.4Economic families are families living together of any age related by blood or marriage, including extended families.
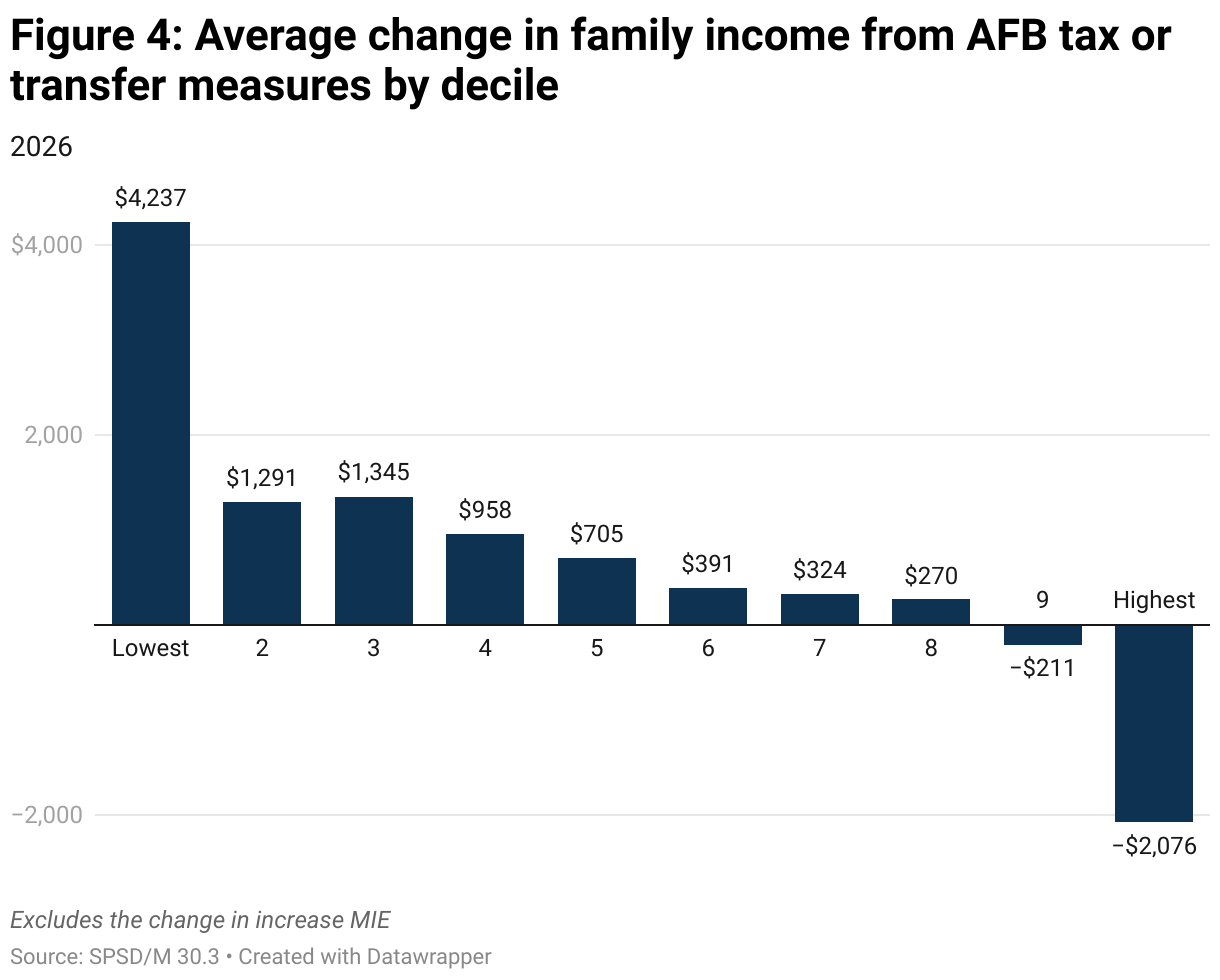
The AFB provides the largest dollar benefits to the lowest-income families—those making under $28,000. They see an average benefit of $4,240 a year from all AFB direct support programs. The major transfers driving this improvement are a Guaranteed Income Supplement (GIS) boost for low-income seniors, the Canada Child Benefit (CCB) to end poverty supplement for low-income families with children, a major improvement in the Canada Disability Benefit and the new Canada Livable income program for adults.
The direct benefits from AFB programs continue through much of the income spectrum, all the way up to the 8th decile. Families making up to $180,000 would still see an average benefit.
However, some would pay more under the AFB plan. Those making $180,000 to $250,000 (the 9th decile) would see a small net cost of higher taxes net of transfers. The richest 10 per cent would pay more under the AFB. Families pulling in a quarter million or more would pay, on average, $2,000 more. This is due to the AFB’s new millionaire tax and the elimination of the dividend gross up/tax credit.
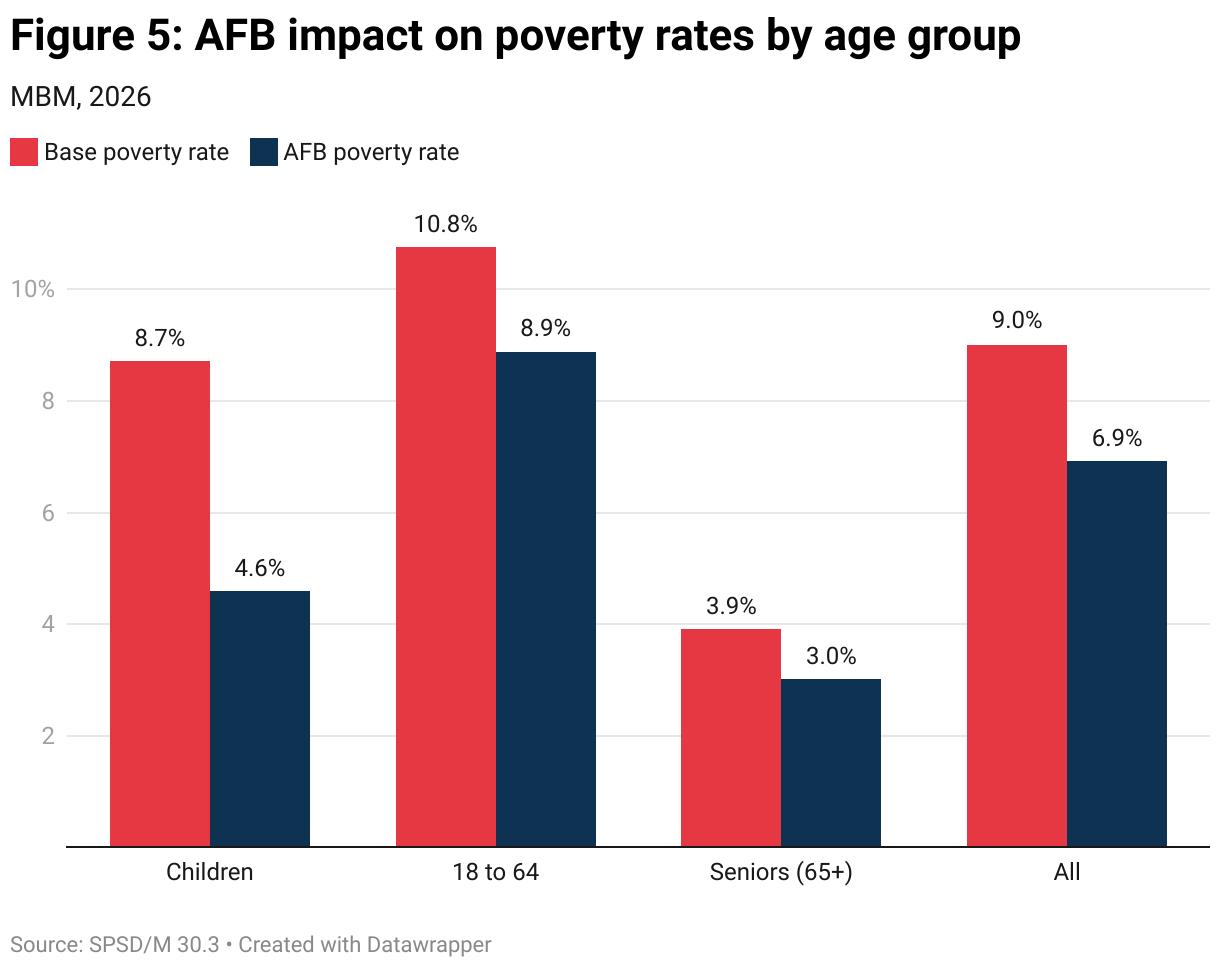
Since many of the AFB programs are targeted to those most in need, we see a marked improvement in poverty rates. In the aggregate, the AFB would lift 836,000 people out of poverty according to the Market Basket Measure (MBM) or 718,000 people according to the Census Family Low Income Measure—After tax (CFLIM-AT).
Child poverty, according to the MBM, would be cut in half by the AFB measures, lifting almost 300,000 children out of poverty. There would be a more limited impact on adults aged 18 to 64, where 470,000 would be lifted out of poverty. About 70,000 seniors would also lifted out of MBM poverty by the AFB.
Determining the poverty impact of policies can be helpful, but they have significant threshold effects. Someone could make $1 below the poverty line and, if they received $1 from an AFB program, they would be considered lifted “out of poverty.” But, practically speaking, their circumstances would be the same. Policies can also be developed that essentially game poverty statistics. They identify those just below the poverty line and lift them just slightly over it, at low cost, giving the illusion of poverty reduction.
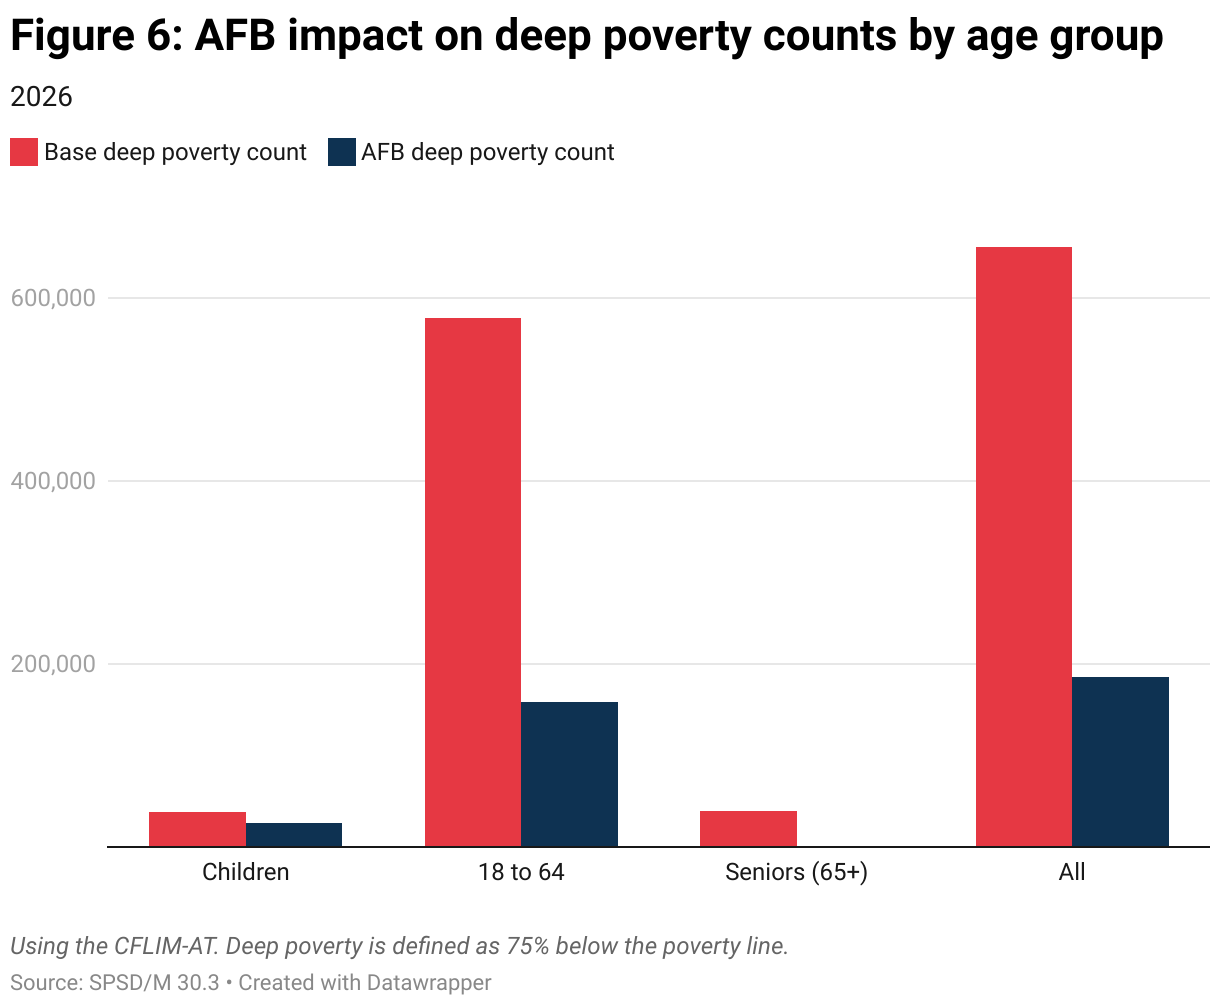
As a result, it’s worth looking at those who would remain in poverty, even after the AFB programs are implemented, to see how their depth of poverty changes. For this exercise, we’ll look at those in deep poverty—those whose income is 75 per cent lower than the general poverty line.
A family of four is in poverty5Statistics Canada, Table 11-10-0232-01, Low income measure (LIM) thresholds by income source and household size, May 1, 2025, https://www150.statcan.gc.ca/t1/tbl1/en/cv!recreate.action?pid=1110023201&selectedNodeIds=2D2,3D2,4D1,4D4&checkedLevels=0D1&refPeriods=20210101,20230101&dimensionLayouts=layout2,layout2,layout2,layout3,layout2&vectorDisplay=false. if its after-tax income is under roughly $60,000 and, for a single person, if their after-tax income is under roughly $30,000. If we had a family of four in deep poverty, it would mean their after-tax income would be under $15,000; for an individual, it would mean income of under $7,500. These would be families in very low income and in very deep poverty, something that should be unacceptable in a country as rich as Canada.
Given existing income support programs, like the Canada Child Benefit, there are few children who live in families with income that low. While the AFB programs would have a big effect on child poverty rate reduction, they would have little impact on deep poverty for families with children, only because most aren’t that low income to begin with.
For adults aged 18-64, it’s quite a different story. There are few income supports outside of the small GST credit and provincial social assistance, which is very hard to obtain. The AFB programs—the Canada Livable Income and major improvements to the Canada Disability Benefit—would have a huge impact on those in deep poverty. The AFB would slash the number of adults living in deep poverty by three quarters, pulling 420,000 adults out of very deep poverty, although not necessarily above the poverty line.
Like children, there are few seniors who live in deep poverty because of important supports, like the Guaranteed Income Supplement (GIS). However, the AFB effectively wipes out deep poverty among the 40,000 seniors. The main AFB mechanism is allowing newly immigrated seniors access to senior support programs, like GIS and Old Age Security (OAS). If seniors have been in Canada for less than 10 years, they wouldn’t be able to access OAS, thereby leaving some in deep poverty. The AFB would credit them with that first 10 years of residency, allowing them access to seniors’ support.
Conclusion
The AFB charts a different path. It would implement new programs to be sure, but it would pay for them as well, resulting in little change to the government deficit. The programs it would create would have high economic and employment impacts. Many of the larger construction programs would have little effect on the deficit because they benefit from accrual accounting. Other new spending would be paid for with tax increases on less economically productive activities, like wealth generation, tax dodging and corporate profit generation and distribution.
Higher growth provides more employment, better wages and lower poverty (with help of new income supports). Higher growth also keeps federal debt to GDP going down. This is the solution that Canada needs now in the face of external threads and internal challenges.
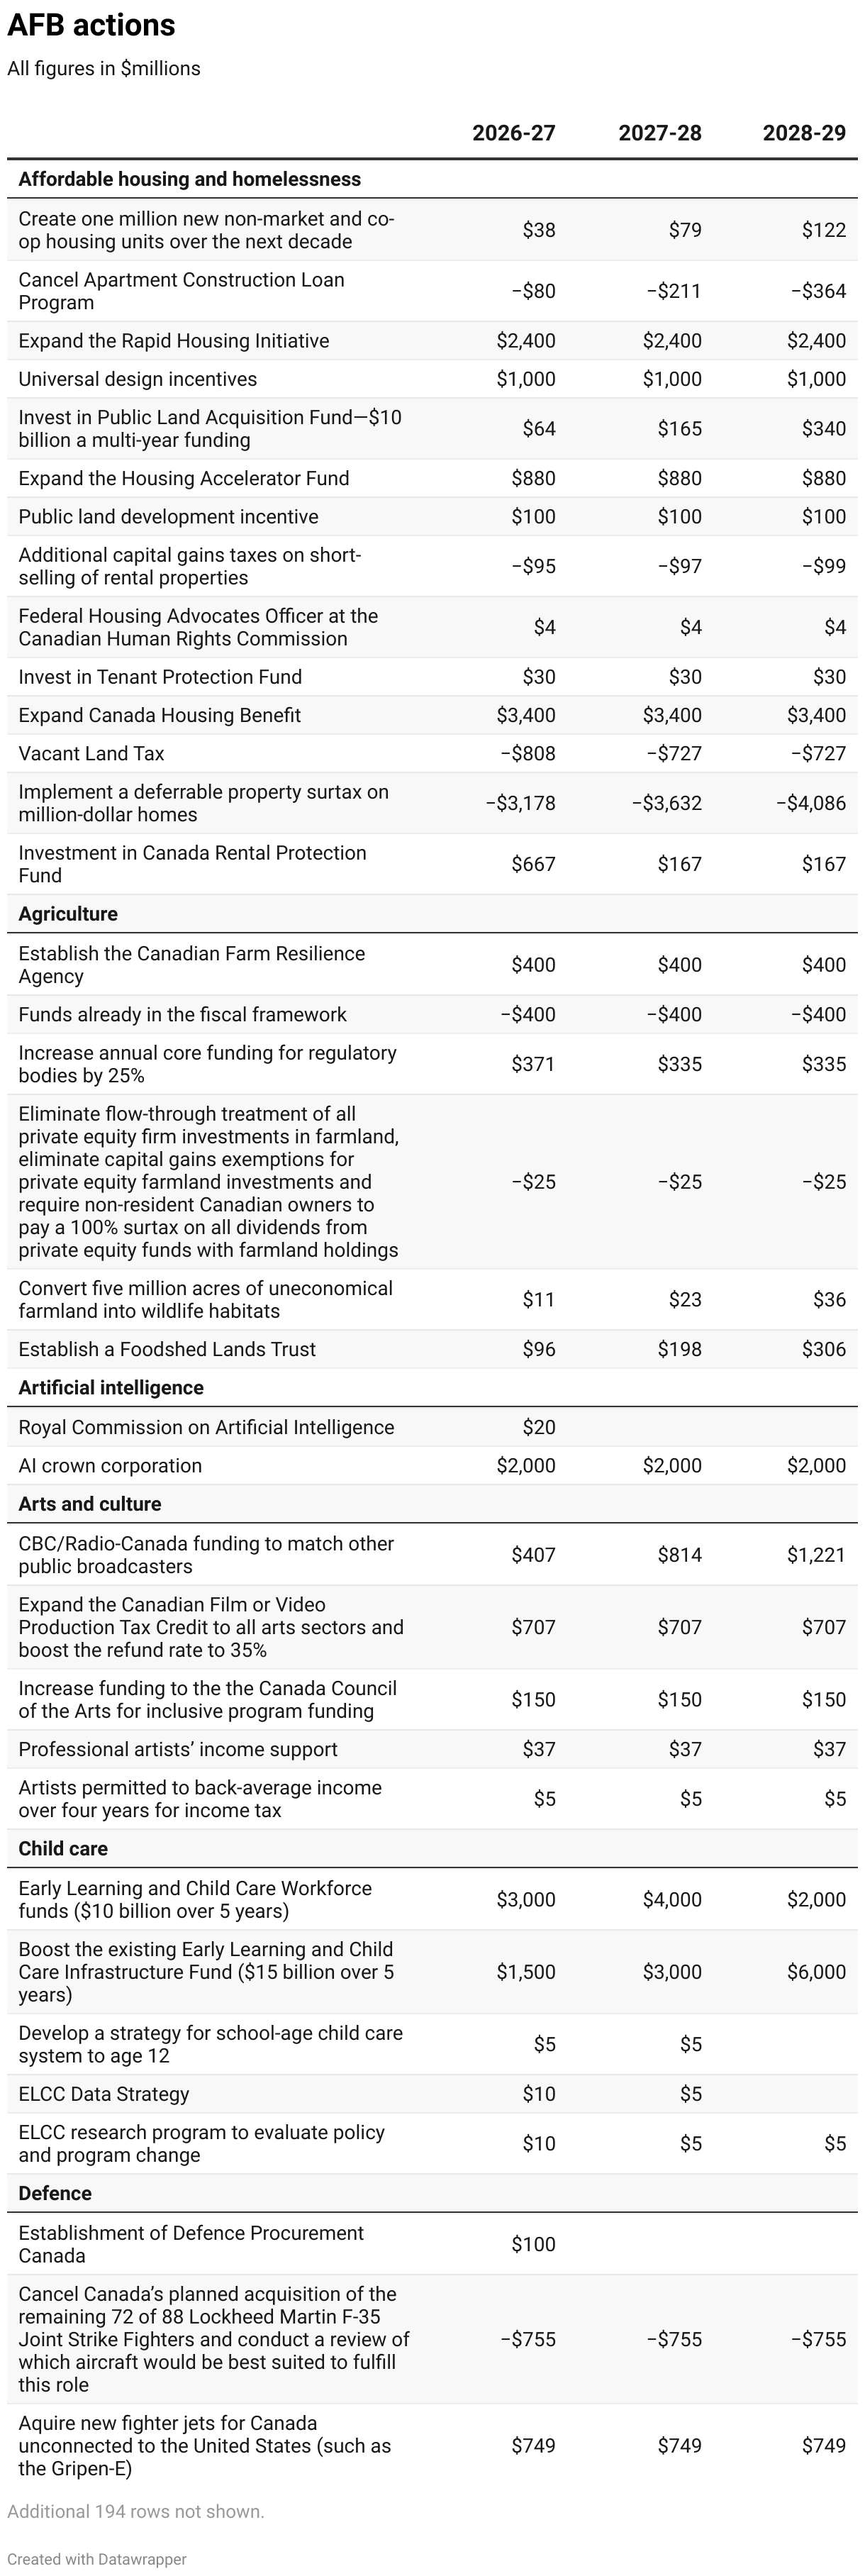
The following table contains a full list of AFB measures, grouped by chapter.