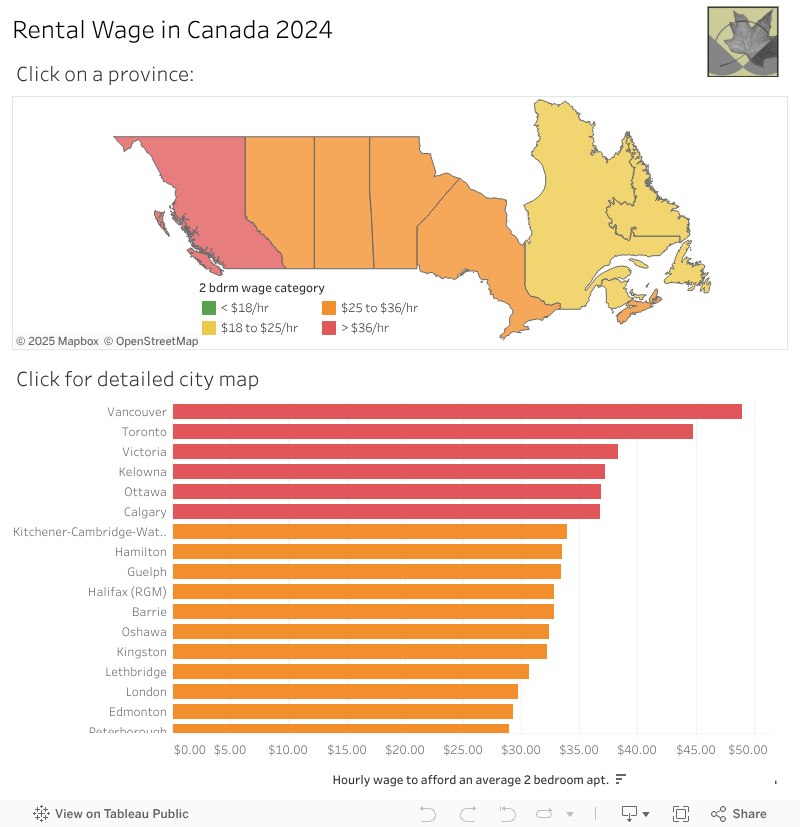
How much do you need to earn to afford an apartment in your neighborhood?
That’s the question that animated researchers at the Canadian Centre for Policy Alternatives when we first introduced the concept of the “rental wage” in 2019. How much money do you need to make per hour (working a 40-hour week for the whole year) in order to pay less than 30 per cent of your income on rent—a generally accepted threshold for affordability?
Every year, we crunch the numbers for every neighbourhood in every large municipality in the country. There have been some modest improvements in some provinces compared to previous years, but the picture remains one of deep lack of affordability, particularly concentrated in specific regions. Minimum wage workers, in particular, continue to struggle.
We go into more detail in the full-length report (which you can read here). On this page, we built a map that can help you look up your own municipality and neighbourhood anywhere in there country.
To get started, click on a province to filter to the cities within it. Click on a city to jump to its neighbourhoods map. Hover over anything for additional information. To reset the map, reload the page. The map may take a moment to load.
The map below shows the most recent available data, from 2024. To see older data for comparison, click here for our equivalent map with data from 2023, or click here for the map with data from 2022.