



Share
Summary
This report provides the 2026 living wage rates for Newfoundland and Labrador (N.L.), Nova Scotia (N.S.), and Prince Edward Island (P.E.I.). It includes regional living wage rates for all three provinces, as well as provincial living wage regional-weighted averages. The Human Development Council publishes New Brunswick’s living wage rates.1Human Development Council. (n.d.) “Research and Reports.” sjhdc.ca/report-category/living-wage/ As shown in Table 1, this year’s regional living wage increases range from just over two per cent to just under 10 per cent, yielding provincial average living wage increases of just under four per cent for Nova Scotia, 5.75 per cent for P.E.I., and 7.39 per cent for Newfoundland and Labrador.
The Labrador-Northern Peninsula region’s living wage has surpassed Halifax’s for the first time, with the highest in the region at $30.50, while Halifax’s is $30. The Northern region of Nova Scotia saw the sharpest increase in its living wage, largely driven by rising rental costs, particularly in Truro. Across the four Atlantic provinces, living wage increases are largely due to transportation budgets, both more accurately costing what is needed, and inflationary cost increases.
Key recommendations summary:
These increases in the living wage reflect cost of living challenges for real households. A large percentage of residents in Atlantic Canada are struggling to cover basic expenses. But this problem CAN be addressed by coordinated action that goes beyond making life more affordable to creating conditions for economic security:
Wages and working conditions
- All employers should pay at least a living wage.
- All levels of government should ensure that all direct and contract employees are paid at least a living wage and include a living-wage provision in all public procurement.
- Provincial governments should significantly raise minimum wages and ensure that all workers are paid at least the same provincial minimum wage.
- Provincial governments must strengthen labour standards to better protect workers’ health, safety, and work-life balance, and enforce them proactively.
- Provincial governments must also strengthen pay equity, extend it to the private sector (not just the public sector), and enact pay-transparency legislation.
- Collective bargaining is an important way to determine wages; as such, governments should remove barriers to unionization to improve workers’ say over their wages and their work.
Government taxes and transfers
- Provincial and federal governments should carefully assess income phase-out thresholds and claw-back levels for existing household supports to expand access and increase amounts, taking annual living-wage incomes into account.
- Improve the progressivity of taxation systems.
Housing
All provinces should:
- Invest in rental subsidy support as a critical, immediate (temporary) policy to help renters who spend more than 30 per cent of their income on housing.
- Institute vacancy control that caps annual increases to once every 12 months for any unit, and freezes rent for at least a year.
- Use legislative changes and funding to support tenants’ organizing efforts, ensure landlords are licensed, and proactively enforce tenants’ rights to prevent renovictions and tenant displacement.
- Substantially increase funding for affordable housing, directed to the public and community (non-profit and co-operative) housing sectors, with a plan that sets targets to eliminate homelessness and meet core housing needs.
Child care
- Central planning and new funding models are needed to sustain long-term investment in non-profit child care to ensure families can access a public system that provides high-quality, licensed, regulated, non-profit, universal care in communities across all provinces and regions.
- The 59 per cent coverage rate is inadequate and should at least reflect the reality for most working families. Child care should be seen as an investment in children, and ideally, universal coverage should be the target, as with public schools.
- More investment is needed to retain current ECE workers and recruit new ones through publicly funded wage grids that guarantee decent wages and benefits for all early childhood educators.
Health care
- Stop privatizing health care and end the patchwork that only builds onto the existing market system.
- Expand universal public health care to cover full, free access to dental care, prescription drugs, mental health, eye care, hearing aids, assistive devices/products, and harm reduction support for substance use disorders and drug use.
Post-secondary education
- Remove barriers to post-secondary education, reduce or eliminate tuition fees, and adequately fund public universities and colleges.
Ensuring fair prices
- Invest in local, sustainable, affordable food production and distribution, and address food insecurity by improving income security.
- Use legislative and regulatory tools to combat anti-competitive practices and price gouging.
- Tackle the digital divide by expanding programs that support low-income households’ access to affordable internet and phone services.
- Take steps to ensure that household costs for essential services are fair and reasonable.
Evidence-based decisions
- Invest in more provincial, local, and regional research to make more robust, disaggregated, and timely data on the costs of essentials available to inform policy decisions.
Introduction
This living wage report should give us pause and prompt us to consider just how many community members across the Atlantic region struggle with the cost of living. It also challenges us to look beyond governments’ narrow focus on “affordability”; the problem isn’t just the cost of living, which keeps our attention only on prices and household budgets. Instead, what matters is the way increases in the cost of living interact with existing inequalities in society. When governments think about this problem as simply “affordability,” they deflect attention away from why so many people are struggling. This focus individualizes the problem, as if we are only consumers in the marketplace, while obscuring why our economy and public policies fail to ensure everyone can live a decent life. The living wage analysis challenges us to consider why people struggle to access the income and services they need, and what must happen to support them. Fundamentally, many residents do not earn enough money and do not have sufficient access to good public programs, to afford the quality of life we should hope for everyone.
Employers paying a living wage is just one part of the solution.
Governments have a responsibility to ensure that the economy serves people’s needs and that the benefits of our collective wealth are shared widely. Economic security should not be a privilege reserved for those who can afford it.
Beyond short-term relief to help households keep up with rising prices, governments need to help them build economic and income security. When housing, food, energy, and other essentials become unaffordable, we need to examine not only prices, but also wages, inequality, the organization of markets, and government policy choices.
A living wage alone cannot resolve a housing crisis or compensate for inadequate public services. Rather, decent wages and strong public services are complementary foundations of a decent life.
Understanding the 2026 Living Wage Rates
Similar to 2025, living wage rates continued to rise across most of Atlantic Canada in 2026. Variation also continues across and within provinces, driven by differences in regional costs, particularly housing, food and transportation. This year, the highest living wage is in the Labrador-Northern Peninsula region, which has slightly surpassed Halifax’s for the first time.
We observe similar cost trends, though they vary by region. In 2026, Northern Nova Scotia recorded the largest increase among the three provinces, largely driven by significant rises in rental costs (particularly in Truro). The increases to base budgets across the three provinces, plus inflationary pressures on transportation fuel, have pushed some living wage rates above inflation (measured to June 2026). This year’s calculation does caution that the year-over-year detailed comparisons are more difficult to make this year given Statistics Canada’s changes in the Market Basket Measure (MBM) methodology.2 Devin, N., Gustajtis, B., Kow, B., Raymond-Brousseau, L. and Steinmetz-Wood, M. (2025). The proposed methodology for the 2023-base Market Basket Measure of poverty. Income Research Paper Series, Statistics Canada. www150.statcan.gc.ca/n1/pub/75f0002m/75f0002m2025003-eng.htm
Living wage rates in P.E.I. increased this year, after remaining unchanged last year. P.E.I.’s living wage rose in both regions, largely because more accurate transportation costs reflect what people must pay to get to where they need to be on time. Although the P.E.I. government previously increased funding for public and regional transport, the system still fails to provide timely, accessible transport for most households outside the Charlottetown centre. P.E.I. also introduced tax cuts and another income transfer programme, the Prince Edward Island Essentials Benefit (PEIEB), but neither provided much relief for these households. The PEIEB guarantees a minimum of $175 per year regardless of income (and a maximum of $365). The need for higher wages to cover additional shelter and transport costs muted the impact of the tax cuts and income transfers.
Across all regions, food and shelter are the two most expensive items in household budgets. Shelter costs account for the largest share of budgets in all provincial regions except Western N.L. and Labrador-Northern Peninsula, where food is more expensive than shelter. P.E.I.’s food costs are similar to those in Nova Scotia. In 2026, child care costs remained highest in Halifax and lowest in rural P.E.I.. In some regions, child care consumes the third-largest portion of the household budget, whereas in most other regions, transportation is the third-largest expense.
As discussed in the technical reports, some cost changes reflect methodological changes to the Market Basket Measure, which have led to significant decreases in household expenses and social inclusion categories. Statistics Canada has also changed how it collects food cost data, which it says has improved their accuracy.
Transportation remains most expensive in N.L. However, transportation costs have increased across the region, largely due to steep inflation affecting gas prices. In addition, Statistics Canada updated the Market Basket Measure’s transportation budget to provide more accurate transportation cost data, including updated second-hand car costs and car-share rides. In addition, we increased the transportation car allowance to better reflect limited transit options across the Atlantic region, especially in rural areas.
Regarding government income benefits, the total loss of the Canada Carbon Rebate in 2026 affected all households, as it was a universal benefit programme. Households received an inflation adjustment to the Canada Child Benefit. In our calculations, households in Newfoundland and Labrador and Nova Scotia did not qualify for any other income benefit programmes. However, households in P.E.I. accessed several provincial programmes, including the new Island Essentials Benefit and the enhanced P.E.I. Child Benefit. Only the living wage household in P.E.I. qualified for the new Canada Groceries and Essentials Benefit because of the inflationary adjustment to the income threshold.
Regarding taxes and tax cuts, the federal government reduced the lowest marginal personal income tax rate from 15 per cent to 14.5 per cent for the 2025 taxation year and to 14 per cent for 2026.3 Department of Finance Canada. (2026). Report on the Impact of Reducing the Lowest Marginal Personal Income Tax Rate on Non-Refundable Tax Credits. Statistics Canada. canada.ca/en/department-finance/services/publications/report-impact-reducing-lowest-marginal-personal-income-tax-rate-non-refundable-tax-credits.html The federal government estimated maximum annual savings of $420 for an individual and $840 for a two-income family. Our calculations show much lower savings that barely affect the living wage, even combined with provincial tax reductions.
Our calculations underscore how critical it is to ensure that programmes and services reach everyone struggling to make ends meet, including those earning a living wage.
Crucially, our analysis also illustrates how little across-the-board tax cuts, such as increasing the Basic Personal Amount and even indexing brackets, do for households that need more income and lower costs. The benefits of those measures disproportionately flow to higher income households. Governments must weigh whether they could use the lost revenue to expand services. Governments must also be more transparent about who benefits from these tax reductions and who pays the price when costs keep rising and benefits, such as gas, fuel, electricity rebates, are spread too thin when extended to households that can afford to overconsume.
Calculating the living wage
In Atlantic Canada, CCPA-NS released the first living wage report in June 2015, publishing Halifax’s living wage report (Working for a Living, Not Living for Work)4 Johnston, MD., & Saulnier, C. (2015). Working for a Living, Not Living for Work: the Halifax Living Wage 2015. CCPA-NS Office. www.policyalternatives.ca/publications/reports/working-living-not-living-work. and the technical calculation guide.
The 2026 living wage calculations continue to follow the principles underpinning the Canadian Living Wage Framework5 Living Wage Canada. (n.d). Canadian Living Wage Framework: A National Methodology For Calculating The Living Wage In Your Community. d3n8a8pro7vhmx.cloudfront.net/ontariolivingwage/pages/110/attachments/original/1574970054/Canadian_Living_Wage_Framework.pdf?1574970054 and are designed to support decent working conditions. The income provides a small buffer against severe financial stress and a small budget to support active participation in the community’s social, recreational, cultural, and civic life.
The living wage is the hourly rate a reference household needs to cover all basic annual expenses. It assumes adults in the household work full-time (35 hours a week) and takes into account tax rates and government income benefits. We recalculate the rate each year to reflect changes in the cost of living and government programmes. We do not simply adjust for inflation.
The reference household
We use a reference household to determine the annual income needed to cover needs, and thus the hourly rate for full-time workers (35 hours a week, full year). The reference is a family of two working parents (aged 35 to 44) and two young children (aged two and seven). The household is also assumed to need full-time child care for the two-year-old, plus care before and after school and during school breaks, with the parents using three weeks of vacation to cover some of these needs (and taking the fourth week for a joint family vacation). This reference household does not cover the full spectrum of real-world situations; for example, no one in this hypothetical household has a chronic illness or disability. We use this reference household as the “standard” approach to cover a range of household situations and help ensure the living wage provides enough annual employment income to support a reasonable standard of living.
Some other provinces have moved to a weighted average based on a family of four, a single parent with one child aged four, and a single individual. We are not moving to a weighted average. Our testing has shown that the annual income from the hourly living wage should be enough for working individuals. Individuals without children may not have child care costs, but they also do not receive the dependent and child care tax deductions or income from child benefits. Whether a single parent with one child has enough income depends on whether they can access affordable licensed child care and the subsidy programs that exist, which are not universal and vary by province. For example, in Nova Scotia, four-year-olds have access to free pre-primary in the public education system. The calculations do not consider other non-universal subsidies, including for rental costs.
The living wage will not address all economic and social challenges; it is designed to provide a realistic assessment of what is needed to make ends meet.
The purpose of the living wage:
- It’s a conservative measure of what people need to earn per year to afford basic expenses based on the cost of living in their area.
- Employers can use it to ensure their workers achieve a decent standard of living.
- Governments can use it to inform minimum wage increases, and to inform income eligibility and cut-offs for public policies and programs designed to help working people and address the needs of low-income working households.
What the living wage is not:
- It is not a statutory minimum wage that the government enforces for all employers. The living wage is not a legally determined wage like the minimum wage. The living wage is a wage paid voluntarily by employers.
The living wage is an important wage benchmark. The living wage calculation provides information about the costs of living in each region: What are the highest costs? What can be done to lower the costs? Which public policy, program, or service could impact the expenses or income?
Calculating the living wage rates: The process and formula
The process begins by collecting the cost of the basic “basket of goods and services” for all household budgets – housing, food, and, transportation, etc. This forms the basis of an annual household budget. From the budget, we can then calculate the hourly and annual earnings workers need to cover those expenses. To calculate this wage, we also include income workers receive in the form of government benefits, and subtract the impact of taxes and other deductions on that income (e.g., federal and provincial income taxes and premiums for Employment Insurance and the Canada Pension Plan). The result is expressed as an hourly (gross) wage that equates to the annual employment income of a full-time (35 hours), full-year (52 weeks) salary.
Figure 1 / Living wage formula
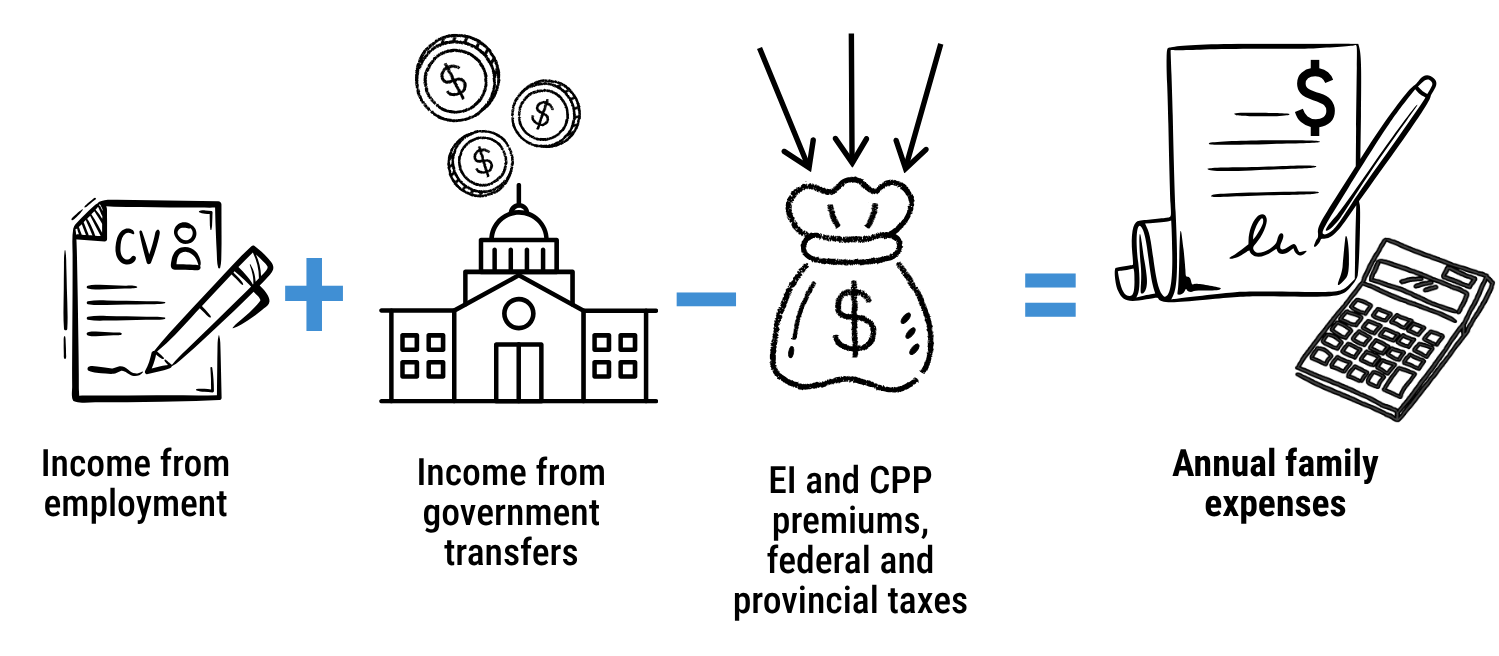
The living wage rate for the 2026 Report is calculated based on the following assumptions:
- Living wage budget costs are based on June 2026.
- Employers provide two weeks of paid vacation.
- The cost of government deductions (provincial and federal taxes, Employment Insurance premiums and Canada Pension Plan contributions) for the 2026 tax year.
- The value of government transfers, such as the Canada Child Benefit, is calculated for January to December 2026 using 2025 family income as a reference (for January to June 2026, we use benefit rates and thresholds based on the 2025 tax year; for July to December 2026, we use those based on the 2026 tax year, following Canada Revenue’s benefit payment periods). The GST/HST credit is included for the first six months of 2026, and the Canada Groceries and Essentials Benefit (CGEB) for the last six months, where families’ income qualifies. The Canada Carbon Rebate is not included, as the program ended in April 2025. We also include all provincial programmes, but living wage households qualify only for the P.E.I. Child Benefit (PEICB) and the new P.E.I. Essentials Benefit (PEIEB), which replaces the P.E.I. Sales Tax Credit, and not for any in N.L. or N.S..
Note that living wage spreadsheets are available upon request.
Living wage household budget
The living wage budget includes ten expense categories, with detailed explanations in the technical reports for each province, including the data and sources used. In some cases, the monthly budget amounts reflect fixed monthly expenses (such as rent), while others are based on an annual total averaged over 12 months. Some of these expenses are one-off yearly amounts, while others fluctuate by season and expense (such as utilities in winter or child care during the school year versus the summer). Many are drawn from the Market Basket Measure (MBM) components, which is Canada’s official poverty line.
- Food: The budget items are from the National Nutritious Food Basket, with prices collected for 38 cities across Canada for the MBM’s reference household.
- Clothing and footwear: The budget is drawn from the MBM and covers clothes and footwear for school, work, and play, including replacement costs for growth and wear.
- Shelter: The shelter amount includes a 3-bedroom rental, basic tenant contents insurance, and utilities (water, fuel, electricity).
- Transportation: This budget item is calculated to cover transportation for daily needs, including shopping, work, and other daily necessities. Costs vary by region and may include maintaining a second-hand car, monthly bus passes (if available), and a modest budget for a limited number of taxi trips or two cars depending on how rural the region–as other provinces’ calculations have done for many years (each provincial technical report explains the amounts). The transportation budget helps the family ensure timely daily travel while still having quality time at home. It is reasonable to assume there will be times, aside from attending community college, when one parent may have the vehicle and transit, even in communities like Halifax, where it is most available, may not be convenient for the parent. In more rural communities, with two parents working, each adult may need a car because transit, if available, is not timely or accessible.
- Child care: This expense covers full-time, full-year child care for the two-year-old and before- and after-school care for the seven-year-old on all teaching days. The budget also includes additional fees for periods when the older child is not in school and needs full-time care, such as March, summer and winter breaks, Professional Development days, and non-statutory holidays. The child care calculations also assume the parents can cover some of the seven-year-old’s time using some of the four weeks of parental leave.
- Health expenses: The budget includes the cost of a basic private health insurance plan covering dental care and prescription drugs not covered by public health care. Workers must still pay deductibles and any remaining costs after insurance, which we assume are covered by household expenses. The Canada Dental Plan is not universal, and some of our reference household incomes are too high to qualify; therefore, we do not include it in our calculations as a discount on private health insurance.
- Contingency/emergency: The family budget includes a modest allowance for unforeseen circumstances, equivalent to two weeks’ pay per parent per year, which is a small percentage of the overall household budget. Many low-wage workers lack access to paid leave for emergencies; this could also help offset lost wages. A small emergency cushion can make a big difference in preventing further problems.
- Parent education: Part-time education for one parent at a community college is within budget. The living wage framework recognizes that additional education and skills could help low-wage workers secure higher-paying jobs.
- Household expenses: This budget item is for other essentials not covered elsewhere, including communications, laundry, toiletries and personal care (e.g., toothbrush, toothpaste, deodorant, shampoo, menstrual products), furniture, small kitchen appliances, or kitchen tools, household supplies (e.g., clingwrap, foil, cleaning supplies), and bank fees. We no longer cost internet services; instead, we use the new MBM’s calculation for Communication costs, which includes landline services, cell phone services, and Internet access services.6To understand the MBM changes, see: Devin, N. et al.. (2025). Op. Cit. As explained in the technical reports for each province, Statistics Canada has made substantial changes to how it calculates the category called “Other,” which we use for household expenses and social inclusion.
- Social inclusion: This budget item covers costs that help reduce stigma and allow family members to participate fully in their community. The form that participation takes could “depend on the structure, age, location or other circumstances of a family.”7Gustajtis, B., & Heisz, A. (2022). Market Basket Measure Technical Paper: The other necessities component. Statistics Canada, Income Research Paper Series. www150.statcan.gc.ca/n1/pub/75f0002m/75f0002m2022006-eng.htm
- This category could be used for expenses such as school supplies and fees, reading materials, minimal recreation and sports fees, art or music classes, a child’s birthday or holiday gifts, a small budget for entertainment (e.g., tickets for a movie, museum fees), restaurant meals, family day-trips or children’s toys or games.
Figure 2 / Living wage budget
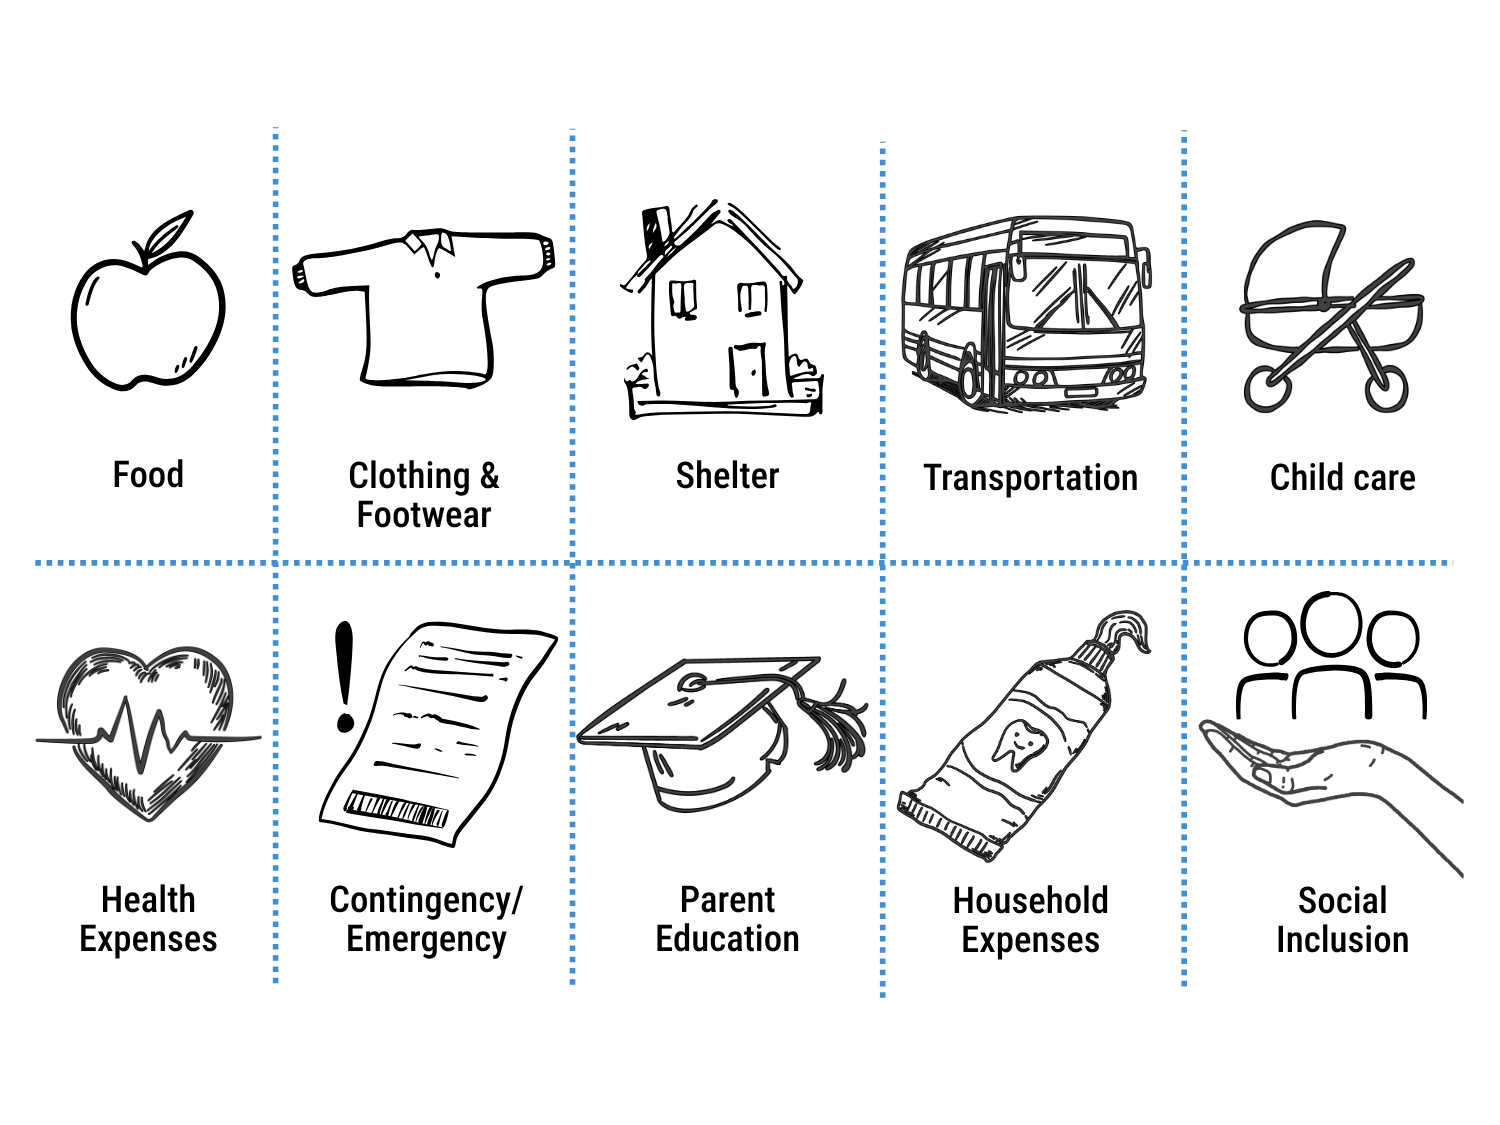
What is NOT included in the living wage budget:
- No special dietary needs or costs of growing and feeding a baby: The Market Basket Measure (MBM) food budget does not cover additional costs for special dietary health needs, cultural or other food preferences, or dining out. The MBM does not include expenses for growing and feeding a baby (whether increased food costs during pregnancy or breastfeeding, or the cost of infant formula), partly because of the reference family used and partly because there is no data for babies in the nutritional basket (for under age two, which is also not part of our reference family).
- No disability or chronic health needs or care: The reference household is assumed to be healthy and requires only a small private health insurance. There is no provision for elder care unless the child care budget can be used once the children age.
- No savings: Beyond the cushion equivalent to four weeks’ pay, which is more for emergencies, there is no dedicated budget for retirement savings. Those with child care may use some of that budget to save for their children’s post-secondary education.
- No debt: Most households in Canada have some form of debt, such as credit cards, student loans, or other debt, but no proxy has been estimated or included.
- No traditional clothing or specified cultural needs: While there is a social inclusion budget, no explicit budget is designated for these needs, as raised in a recent report on the poverty line and Mi’kmaq communities.8Ta’n Etli-tpi’tmk (TEA) & Ontario Native Welfare Administrators Association (ONWAA). (2024). Market Basket Measure research report: Cost of living for First Nations persons with disabilities living on-reserve in Nova Scotia. www.msgam.ca/reports-plans#h.spd1v3czrc4s
- No pets: The household is assumed to have no pets, for disability needs or otherwise.
- No life insurance: Ensuring funeral and burial costs are covered, and perhaps providing a small amount to the children, but this is not included in the living wage budget.
The Living Wage Gap: Wages are not keeping up
As of October 2026, a significant gap remains between minimum wages and living wages. For people in Atlantic Canada, the living wage gap is just under $7 an hour for P.E.I., just under $12 an hour for N.S., and just under $11 an hour for N.L.. As Table 3 further illustrates, these minimum wages, as compared to the provincial weighted average, are a significant percentage less than what it would need to be if we expected it to enable people to pay basic living costs.
Households making less than the living wage face a severe reduction in the quality of life.
The labour market across the Atlantic region is perpetually low-waged.
There are a number of ways to consider just how low. P.E.I. and N.S. are often competing for the lowest average wages in the country. N.L.’s average wages are being pulled up by a small number of high-wage earners.9 Data from the Labour Force Survey PUMF for January to September 2026 show that P.E.I. had the lowest average weekly wages ($1,178), N.S. had the fourth lowest ($1,236), and N.L. had the seventh lowest ($1,300), all below the national average ($1,368). However, within the Atlantic provinces, N.L had the largest gap between average and median weekly wages ($1,120), indicating that higher-paid workers are pulling up the average.
While minimum wage workers make up less than 10 per cent of the workforce in each of these three provinces, a high percentage earn less than $20 an hour, as shown in Table 4. This table also highlights a continuing troubling gendered trend: more women than men earn $20 an hour or less.
Table 5 compares median wages in each province with provincial living wages and shows that close to 50 per cent of the labour market in Nova Scotia earns less than the living wage, and slightly more than that in N.L., with only P.E.I. having a gap to the median hourly wage rate. The percentages vary depending on where you live and work, based on regional living wage rates.
Far too many workers are not earning enough to cover essentials for living; this affects them, but it also affects businesses and us as a broader community. If employees cannot afford the goods and services that they help produce, then businesses need to rethink their model. It is very short-sighted for businesses to assume that paying a living wage is impossible because it raises labour costs and narrows profit margins. There is ample evidence across our country and internationally of the benefits for employers of paying a living wage. Paying living wages has been shown to reduce absenteeism and staff turnover, improve morale and productivity, reduce turnover costs, make recruitment easier, and improve customer service and satisfaction. A survey of living wage employers in BC found that 97 per cent reported some benefit.10 Ivanova, I., French, A., & Oliveira, T. (2023). Working for a Living Wage: Making paid work meet basic family needs in Metro Vancouver. CCPA B.C., Office & Living Wage for Families B.C. policyalternatives.ca/sites/default/files/uploads/publications/2023/11/ccpa-bc-Working-for-a-Living-Wage-2023.pdf
Nova Scotia living wage update for 2026
Since 2021, we have calculated living wages in Nova Scotia for five regions. These regions are:
- Annapolis Valley (Annapolis, Kings, and Hants counties)
- Cape Breton (Cape Breton, Inverness, Richmond, and Victoria counties)
- Halifax (Halifax County)
- Northern (Antigonish, Colchester, Cumberland, Guysborough, and Pictou counties)
- Southern (Digby, Lunenburg, Queens, Shelburne, and Yarmouth counties)
Regional rates enable comparisons across Nova Scotia, reflecting cost impacts and the availability of products and services. These rates cover a larger geographic area than small community rates because we know that people often work in one community, use child care in another, and live in yet another. We also calculated an average provincial living wage, weighted by where the working-age population lives.
As shown in Table 6, although Halifax continues to have the highest living wage in Nova Scotia, other regions have seen much larger increases than Halifax. Nova Scotia’s Northern wage has narrowed the gap to Annapolis Valley’s living wage, while Cape Breton’s living wage has increased slightly more this year..
In 2025, wages in Halifax were 17 per cent higher than in Cape Breton. Although Cape Breton still has the province’s lowest living wage, the gap has narrowed to 14 per cent in 2026. The smallest difference is between Northern and the Valley, with Northern only eight per cent lower than Halifax.
Table 6 shows that the Northern region recorded the largest year-over-year increase, driven largely by housing costs. To better reflect costs, the Market Basket Measure’s transportation budget includes updated pricing on the second-hand car, and also includes ride-share and taxi services. These changes plus the very high increase in the cost of fuel, have increased this budget item for Nova Scotia.
These living wage increases (two to almost 10 per cent) are a bit higher, but similar to last year’s increases, which ranged from one to six per cent for Nova Scotia,11Saulnier, C. and Williams, R. (2024). 2024 Living Wages for Newfoundland and Labrador, Nova Scotia and Prince Edward Island Canadian Centre for Policy Alternatives Nova Scotia. www.policyalternatives.ca/wp-content/uploads/2024/11/2024-Living-Wages-for-Newfoundland-and-Labrador-Nova-Scotia-and-Prince-Edward-Island.pdf and significantly smaller increases than in 2023, when increases ranged from 11 to 19 per cent.12Saulnier, C. (2023). Living wages in Nova Scotia 2023 update: Working for a living, not living to work. Canadian Centre for Policy Alternatives Nova Scotia. policyalternatives.ca/sites/default/files/uploads/publications/Nova%20Scotia%20Office/2023/09/FinalLivingWagesinNovaScotia2023_0.pdf Cost increases have generally slowed, meaning the living wage is not rising quite as quickly, but as we note below, costs are still increasing in many areas. One significant loss to households is the full cancellation of the Canada Carbon Rebate, which helped offset last year’s higher inflation. The Canada Child Benefit is adjusted for inflation, which helps, but some of it is clawed back as employment income rises. As in previous years, because income eligibility thresholds have not increased, the living wage households are still not eligible to access the Nova Scotia Affordable Living Tax Credit (only available if adjusted family net income is below $35,100)13 Government of Nova Scotia. (n.d.) “Taxation: forms and documents.” www.novascotia.ca/finance/en/home/taxation/tax101/personalincometax/altc-prc.aspx.html or the Nova Scotia Child Benefit for households with adjusted family net income below $34,000 depending on the number of children, but the maximum benefit is only available for families with income below $26,000 (neither the income thresholds nor the benefit amounts have been updated since 2023).14 Government of Nova Scotia. (2023). “Nova Scotia Child Benefit.” novascotia.ca/coms/families/childbenefit.html
Budgetary costs 2026 for Nova Scotia regions
The three top expenses in the budget for all regions in Nova Scotia are shelter, food and child care, in that order (see Table 7).
With shelter taking up between 28 per cent (Southern) and 36 per cent (Halifax) of budgets, any increases in rental prices for each region drive up budgets overall.
Nova Scotia lacks permanently affordable apartments outside the market (i.e., co-ops, non-profits, public/social housing), and the market particularly lacks suitable apartments for families or for sharing among non-family members for affordability reasons. The vacancy rate for three-bedroom apartments was 1.5 per cent in 2024 and 1.8 per cent in 2025.15 Canadian Mortgage and Housing Corporation (CMHC). (2025). “Rental Market Survey, Halifax 2025.” Table 3.1.1. www.cmhc-schl.gc.ca/professionals/housing-markets-data-and-research/housing-data/data-tables/rental-market/rental-market-report-data-tables As of October 2025, only 8.6 per cent of the rental stock in the Halifax Census Metropolitan Area (CMA) comprises three-plus bedroom units.16 CMHC. (2025). Op. Cit. Table 3.1.3.
Child care in Nova Scotia
As of 2025, 38 per cent of children under age six have access to adequate full-time child care in the province.17 See Figure 3 in: Macdonald, D. (2025.) Cash cow: Assessing child care space creation progress. CCPA. www.policyalternatives.ca/news-research/cash-cow-assessing-child-care-space-creation-progress/ However, at the community level, 34 per cent live in a child care desert, another 36 per cent have inadequate coverage, and 30 per cent of communities meet the target coverage in the bilateral agreement.18 See Figure 7: Macdonald, D. (2025). Cash Cow. Op. Cit. In rural communities, 47 per cent live in child care deserts, compared with 19 per cent in Halifax.19See Figure 9: Macdonald, D. (2025). Cash Cow. Op. Cit. Although Nova Scotia will have enough spaces for 59 per cent of children by 2027, it is worth questioning why this was the Bilateral target, even if it is achieved. In 2025, the province’s labour market participation rate for women aged 25 and over with children under three was 80.9 per cent. Additionally, 86.5 per cent of mothers with children aged four to five and 87.5 per cent of those with children aged six to twelve were working.20 Statistics Canada. (2026). “Table 14-10-0396-01 Labour force characteristics by family structure, annual, unadjusted for seasonality.” doi.org/10.25318/1410039601-eng. For women who have a spouse or partner, and their spouse or partner is employed. For men that ranges from 95 per cent to 95.7 per cent. This suggests the 59 per cent target will be inadequate. Furthermore, the number of spaces needed should be counted separately for those requiring full-day spaces in centres and those needing before- and after-school care, as these should not be considered equivalent options. Lastly, a provincial coverage rate does not show whether spaces are available where families need them nor whether the care best meets diverse children’s needs or family circumstances.
Explaining changes in living wage rates beyond budget costs
As shown in Table 9, all five regions in N.S. saw a decrease in government transfers overall this year. Government deductions increased across the board, mostly because higher household income triggered increases to Employment Insurance (EI) and the Canada Pension Plan, and muted the tax reductions.
Nova Scotia indexes its tax bracket (3.1 per cent for 2025 and 1.6 per cent for 2026) and the basic personal amount, but does not index tax credits as the federal government does. No other major tax changes were made in 2026; however, in 2025 Nova Scotia removed income-based reductions for the Basic Personal Amount (BPA), Age Amount, Spousal Amount, and Eligible Dependent Amount, allowing all eligible taxpayers to claim the full value of these credits regardless of income level.
In this year’s calculation, cost increases in family expenses do not always translate to a similar percentage increase in the living wage rate (calculated to ensure sufficient total annual employment income pre-tax). The differences between regions are:
- Halifax’s employment income had to rise slightly more than the budgetary costs because of higher taxes and payroll deductions, which require a higher overall income, but end up lowering government transfers.
- The Northern region saw the largest increase in shelter, resulting in the largest overall budget increase of 7.09 per cent. This significant increase in the Northern region translated into a considerable rise in government deductions.
- The second largest overall budget increase was in Cape Breton at just over three per cent, which increased deductions and decreased transfers.
- The overall budget for the Southern region only increased by 1.78 per cent. The Southern region needed a 3.38 per cent increase in employment income because transfers decreased, resulting in a slight increase in deductions.
- The Annapolis Valley had the third-largest increase in family expenses, at 2.17 per cent, with a 3.31 per cent increase in employment income needed to cover additional government deductions and a loss of transfers.
The calculation illustrates the need for balanced and effective solutions, focused on decent working conditions, government redistributive income supports, fair taxation, and the regulation of the costs of essential services or their removal from the market through public services.
Newfoundland and Labrador living wage update for 2026
In assessing the living wage for Newfoundland and Labrador, we divide the province into four regions: Eastern, Central, Western and a “Northern” region, including Labrador and part of the Northern Peninsula. We do this for several reasons. Although the living wage varies less across the Eastern, Central and Western regions, there are significant differences in living costs within the province–essentially, shelter is more expensive in the Eastern region, where the rising costs of urban housing seen elsewhere in Canada have become a challenge in the St. John’s metro area–a trend that has had a big impact on the living wage rate for that region in recent years. In the Northern Region, food costs are a unique challenge.
In 2025, the living wage grew more slowly than in 2023 and 2024 in Newfoundland and Labrador. Slowing inflation and the Canadian Carbon Rebate slowed the rate of increase in household budgets. If that was a good-news year, 2026 is bad news.
The living wage has jumped considerably again this year – the provincial weighted average living wage increased 7.39 per cent – equivalent to almost two dollars an hour. We note here that the provincial government increased the minimum wage by 35 cents an hour in April, to $16.35. This means the gap between the living wage and the minimum wage grew much larger this year. This gap between what people earn and what they need to cover costs, “affordability,” has understandably emerged as a major theme in local politics. But as noted above, “affordability” in this context has to be linked to low wages.
In the Eastern Region, which includes the metro St. John’s area, high food and transportation costs have combined with a shifting housing market, driving rents up in recent years. This year’s living wage grew by 8.27 per cent to $27.50 an hour.
Even more eye-watering, the Northern Region remains unique. Labrador, which already had one of the highest living wages in the country, saw another 7.77 per cent increase this year to $30.50 an hour–the highest regional rate covered by our report.
Explaining budgetary cost changes
The major driver for the living wage calculation in Newfoundland and Labrador since 2023 has been increases in the cost of living. After slower growth last year, the living wage has jumped again in 2026, mainly as a consequence of increased costs for transportation. While it would be easy to write this off as a product of higher fuel costs, it has to be remembered that residents of Newfoundland and Labrador are highly exposed to these price changes because the public transit system in metro regions remains underdeveloped. Since our initial 2023 living wage report, we have noted that one of the key concerns of our reference case household is the extent to which they are dependent on personal vehicles for mobility. This year that dependency is more expensive.
While there have been some areas of “good news” this year; the pace of food inflation has slowed, increased transportation costs drowns that out.
To put it simply, inflation continues to hit lower-income working households harder than might generally be the case because overall increases in the cost of living continue to be high on essentials – this year, the cost of transportation and housing.
Without a focus on raising wages to keep pace with these costs or expanding programs that save working households more money, the gap between what people earn and what they need to earn continues to grow.
Government income benefits and taxes
Government transfer and taxation policies also offered residents of the province some relief this year. The federal inflationary adjustment in the Canada Child Benefit helps our reference household. However, residents will receive no more Canada Carbon Rebate (having received the last quarter payment in April of 2025). Before its cancellation, the Canada Carbon Rebate had a significant positive impact on lower-income household budgets, particularly in rural areas of the province. Changes in federal tax rates and brackets also provided a small benefit to our reference household this year, as did similar moves by the provincial government. Essentially, several government tax and transfer policies have helped offset the impact of cost-of-living increases on low-income working households. However, the opportunity cost of some of these tax cuts should give us pause to consider any further across-the-board cuts, whether on fuel, electricity, or taxes.
Government of Newfoundland and Labrador affordability measures
In Budget 2026, the Government of Newfoundland and Labrador rolled out the start of a series of “affordability” initiatives designed to reduce the cost of living for residents. This started with general across-the-board tax cuts in the budget. In the Fall, the government expanded home energy cost rebates and has made vague promises that more will come prior to the 2027 budget. With much higher than expected oil revenues, the province has considerable budget space to help residents like the living wage reference-case household. Unfortunately, as we have argued elsewhere, these measures are generally expensive mistakes.21Cerdas Sandi, D., Saulnier, C. and Williams, R. (2026). The value and benefits of public spending for households in Newfoundland and Labrador. CCPA Nova Scotia. www.policyalternatives.ca/news-research/nl-value-of-public-spending/
Government resources that could target lower income households are being spent on “affordability” to help households with higher incomes. These measures do not do much to address the living wage gap. For example, in Budget 2026, the government spent $123.1 million dollars to raise the basic personal income exemption. Almost 70 per cent of that benefit flowed to households making over $100,000 a year.22 See Table 6: Cerdas Sandi, D., Saulnier, C. and Williams, R. (2026). Op. Cit.
While we will be watching these affordability measures closely in the months ahead, it is unquestionable that the government should pay closer attention to the policy recommendations in this report. Simply, their current “affordability” measures are not closing the living wage gap in the province.
Indeed, governments can do more to help people below the living wage line. We have suggested a range of policy changes below. Worryingly, based on current trends in inflation, the living wage will likely increase again next year. Addressing the gap between what people earn and what they need to earn requires far more sustained effort.
There are still big gaps in federal and provincial programs designed to reduce poverty or increase economic equality. Because the required living wage has grown so much, our reference case households do not qualify for a range of supports to reduce the cost of living and have had other transfers further clawed back (the CCB in particular).
Provincially, our reference household does not qualify for the Newfoundland and Labrador Child Benefit. To fully qualify for the N.L. Child Benefit, a family’s net income needs to be less than $20,397 a year. If family income is between $20,397 and $38,193, they can receive a reduced amount. Families with an income higher than $38,193 do not qualify for the benefit.23 Government of Newfoundland and Labrador. (n.d.) “The Newfoundland and Labrador Child Benefit (NLCB).” www.gov.nl.ca/sswb/income-support/child/ The benefit amount is also not very much: the maximum per month per child is $157.33. The support phases out at a very low-income, representing a tiny fraction of what the reference household needs to earn to cover basic expenses and is well below the poverty line. Bluntly, this program is “designed to fail”. Very few working households qualify; No living wage working household qualifies. In our recent report on the value of public services, we modeled what putting the same cost of just one of the across-the-board tax cuts in Budget 2026 into increased eligibility for the Child Benefit would do, and the result would reduce the child poverty rate from 10.8 per cent to 4 per cent.24 Cerdas Sandi, D., Saulnier, C. and Williams, R. (2026). Op. Cit., p. 29–30. Budgets are political choices. Helping working low income families with children has not been a priority for the government.
The Newfoundland and Labrador Income Supplement is also flawed. Part of a suite of measures to help seniors, persons with disabilities and low-income households, it replaced a provincial HST credit. It can provide an annual benefit of up to $520 for a single individual, $589 for a couple, plus $231 per child under 19 years of age, but only households with total family incomes between $15,000 and $40,000, receive the full benefit. For households with income higher than $40,000 the benefit is reduced at a rate of 9 per cent; for example, our reference household with a family net income of $51,678 or more does not qualify for the benefit.25 Government of Newfoundland and Labrador. (n.d.) “NL Income Supplement and the NL Seniors’ Benefit.” www.gov.nl.ca/fin/tax-programs-incentives/personal/income-supplement/ At most, this is less than half what our reference household needs to earn in order to afford essentials —this is not a policy designed to help working people. Poverty traps like this with extremely low eligibility cut-offs are poor social policy in general, but in this case they help illustrate the extent to which provincial governments simply haven’t grasped how much the cost of living has shifted over the last decade.
Similarly, most residents in the province do not have access to affordable public transit, which helps manage transportation costs in other parts of Canada. Education and tuition costs have also increased considerably — tuition at Memorial University has more than doubled since 2021. The provincial government has a great deal of work to do to address these issues.
Federally, the reference household does not qualify for the full benefit from the Canada Child Benefit (CCB), or any other income support program; not the Canada Worker Benefit or the GST Credit, as they make too much money – something we have focused on in previous years. Many residents rightfully feel that they get punished for trying to move out of the lowest levels of poverty.
Housing analysis
As in the rest of Atlantic Canada, housing costs are a major problem, especially in St.John’s. The average rent for two-bedroom units increased 6.5 per cent between October 2024 to October 2025 (the previous year the annual increase was 3.5 per cent).26 CMHC. (2025). “Rental Market Survey, Newfoundland and Labrador 2025.” Table 3.1.5. www.cmhc-schl.gc.ca/professionals/housing-markets-data-and-research/housing-data/data-tables/rental-market/rental-market-report-data-tables Those increases mean many households are insecurely housed, paying too much of their income on rent, and worried about what might happen next month. With very little non-market permanently-affordable rental housing, the province is in a poor position to manage the current crisis. The most recent rental report from CMHC shows that N.L.’s vacancy rate has not changed much, from 1.1 per cent to 2.2 per cent, and St. John’s has moved from 0.9 per cent to 1.8 per cent (2024 compared to 2025).27 CMHC. (2025). “Rental Market Survey, Newfoundland and Labrador 2025.” Table 3.1.5. Op. Cit. The apartment turnover rate (two-bedroom units) has increased slightly, indicating very little movement in the rental market (from 11.6 to 11.8 per cent).28 CMHC. (2025). “Rental Market Survey, Newfoundland and Labrador 2025.” Table 3.1.6. Op. Cit.
Child care analysis
On paper, Newfoundland and Labrador has already met the $ 10-a-day target for licensed child care (down from the set fees, depending on the child’s age, of $44/33/30 a day in 2019).29Macdonald, D., & Friendly, M. (2025). The price is not right (yet): $10-a-day child care falling short of target. CCPA. www.policyalternatives.ca/news-research/the-price-is-not-right-yet-10-a-day-child-care-falling-short-of-target/ N.L. also offers a child care subsidy program,30Government of Newfoundland and Labrador. (2022). Child Care Subsidy Policy Manual. www.gov.nl.ca/education/files/Child-Care-Subsidy-Policy-Manual-2022-01-01-Final-1.pdf which is vital because even $10 a day can be unaffordable for many families. However, strict eligibility criteria–including a needs assessment and income requirements–mean only a few can access it, not even all low-income families.
Making licensed child care more affordable was easy to implement by replacing parent fees with funding to the centres. However, many barriers to access still exist in Newfoundland and Labrador. The provincial coverage rate is the lowest in the Atlantic region at 35 per cent of non-school-aged children having access to full-time licensed care. When we look closer at a community level, we find that 37 per cent of children live in “child care deserts” where there is no access, and another 55 per cent face inadequate coverage (the second-highest rate in the country). Only seven per cent of communities have adequate coverage, with 59 per cent of access being the target. Across the province, 54 per cent of rural children reside in child care deserts.31 Macdonald, D. (2025). Cash Cow. Op. cit.
While N.L. has made some progress, much more is needed to ensure families can access care wherever they live. The projected decline in the child population is the highest in the country (15 per cent between 2021 and 2027); having child care could help retain and even grow families.
Planning for more public and not-for-profit child care spaces should be based on coverage needed in communities, and not on whether someone is willing to open or expand a business. The N.L. government plans to roll out 3,000 regulated non-profit child care spaces that they are calling pre-kindergarten.32 Government of Newfoundland and Labrador. (n.d.) “Pre-Kindergarten.” www.gov.nl.ca/education/earlychildhood/kinderstart/ However, unlike in Nova Scotia, the program will be offered by a non-profit, and not as part of the public education system. While non-profit early learning is often higher quality than for-profit options, it still offers less security and permanence than a fully publicly-delivered system. Recent announcements about new non-profit spaces are welcome to families who wait for the actual available spaces for their children.33 Government of Newfoundland and Labrador. (2026). “New Metro Child Care Spaces to Support Recruitment and Retention in Health Care.” News Release. www.gov.nl.ca/releases/2026/eecd/1030n01/ Fortunately, the province has a central waiting list,34 Government of Newfoundland and Labrador. (n.d.) “Early Learning Gateway.” www.gov.nl.ca/earlylearninggateway/ which can help facilitate access to these spaces, though we caution that prioritizing low-income households is critical.
In summary, the province needs more child care spaces, and directed public funding to provide those services. This is a clear illustration of how increased public spending on services that provide net positive economic impacts CAN also make life more affordable for low income working families.
Remote Communities
As noted above, the living wage rate in Labrador is extremely high. Governments are not doing enough to support residents in the living wage Labrador-Northern Peninsula region. Costs of living there are comparable to many of the high-cost urban areas of the country, but without the benefits of improved public services – like transit that exist in big cities. While living wages tend to be high in urban areas because of rapid increases in housing costs, the northern region in Newfoundland and Labrador faces unique challenges with housing scarcity and extremely high food and transportation costs. The housing costs in our budget do not reflect what is available, the overcrowded conditions, or other quality issues. The transportation costs do not reflect recent decisions to provide flight vouchers, which will undoubtedly help some households.35 Government of Newfoundland and Labrador. (2026). “Investments in Health and Well-Being for Residents of Labrador.“ www.gov.nl.ca/releases/2026/la/0708n04/
While the living wage was already high in the region, it increased further this year and is now the highest in the Atlantic region and one of the highest in the country.
Government failure to better support these households makes it extremely hard for people to make ends meet and has a demonstrable negative impact on health and quality of life. It also means that the burden for dealing with the crisis falls more directly on employers.
Gender and the Newfoundland and Labrador living wage
Finally, the province has a highly unequal wage structure. Some workers, mainly men in the resource sector, have higher incomes, while women workers in the service sector lag far behind. N.L. has a big gender wage gap problem.36 Cerdas Sandí, D. and Saulnier, C. (2026). Closing the gaps: Gender pay inequity in Atlantic Canada. CCPA Nova Scotia. www.policyalternatives.ca/news-research/closing-the-gaps/ We note that in this year’s analysis, the median hourly wage in the province for women is lower than the weighted average for the living wage ($26.38 versus $27.18). Half of women workers in the province do not receive a living wage. Indeed, while it has been true for some time that wages in the service sector often fall short of the living wage, there is also clear evidence that many women working in the provision of publicly funded services – home care workers and early child educators, for example, also do not earn a living wage.
As explained in our recommendations below, governments can do a lot about this. Indeed, in a province that is willing to spend considerable sums on affordability measures, targeting the living wage gap is vital to basic equity.
Prince Edward Island living wage update for 2026
The Prince Edward Island living wage rates are regional, not specific to Charlottetown and Summerside. The Charlottetown wage covers the entire census area, while the Summerside wage covers the rest of Prince Edward Island, including more rural areas. Summerside is more populated than many smaller, more rural areas, but limited data availability prevents us from calculating a smaller regional wage. Regional rates provide broader geographic coverage than community rates and better reflect people’s lives; people might work in one community, use child care in another, and live in yet another. Living wage calculations are regional to better capture differences between areas, depending on the availability of products and services and the cost of essentials, including apartments, food, transportation, internet, and clothing. The Census 2021 working-age population then weights both regional wages to produce a provincial-weighted average. This weighted average should inform the provincial minimum wage.
P.E.I. living wage costs
Appendix C explains in detail what each budget includes, each item, and the data sources used to determine the amounts. Table 15 below provides the monthly expense amounts for both regions. The primary data sources are Statistics Canada and the Market Basket Measure for food, clothing, transportation, household expenses, and social inclusion. The rental data is from the Canadian Mortgage and Housing Corporation.
Food and shelter are the two most expensive budget items in both regions, accounting for 49 per cent of the Charlottetown budget and just over 44 per cent of the P.E.I. rural budget, as can be seen in Table 16 below. The child care budget has not increased very much this year, while the base budget for transportation has pushed it higher than child care for the third most expensive item. The living wage is lower in the P.E.I. than elsewhere in Atlantic Canada because the cost of living is generally a bit more manageable. Unfortunately, more investment is needed to make transit more available; Islanders have shared that they cannot rely on it “due to conflicting schedules, limited routes and transit unavailability.”37 Mendiolea, J. (2025). “Missing the bus: How public transit gaps are impacting P.E.I. residents.” The Telegram. www.saltwire.com/newfoundland-labrador/how-public-transit-gaps-are-impacting-pei-residents While housing is much more expensive in Charlottetown, without sufficient access to transit, those without reliable personal vehicles have limited choices about where to live, and many in rural areas experience isolation.
As Table 16 shows, housing is the most expensive budget item. Child care is now the fourth-highest cost in this household budget, with transportation surpassing it. Child care includes licensed, regulated care for the toddler (aged two) and care for the seven-year-old when they are not in school (before and after school, professional development days, March break, holiday break, and summer break).
P.E.I. has already reached the $ 10-a-day target for licensed spaces, a significant drop from the 2019 set fees, depending on the child’s age, of $34/28/27 a day, representing median monthly savings of $369 for preschool-aged child care.38 Macdonald, D., & Friendly, M. (2025). The price is not right (yet). Op. Cit. However, not all families can access this more affordable care, though child care fees, whether licensed or unlicensed, are dropping, especially for the non-school-aged children.
Licensed spaces in P.E.I. have expanded to 57 per cent provincially, meaning 57 per cent of non-school-aged children have access to full-time licensed care. It is, however, concerning that 80 per cent of the new spaces have been in the for-profit sector in P.E.I.. P.E.I. has the second-highest percentage of children who meet the federal target of 59 per cent coverage, at 63 per cent (second to Quebec). 39 Macdonald, D. (2025). Cash Cow. Op. Cit.
A 2024 survey of child care staff and directors in P.E.I.40 Flanagan, K. and Associates. (2025). Early Learning and Child Care Recruitment and Retention: P.E.I.’S 2024. Director and Staff Surveys. Final Report. Early Childhood Development Association of PEI. mcusercontent.com/aff981eb17e452f90e6094988/files/50178ef2-2c85-9175-8afd-59f7f42ff215/2024_ELCC_Director_and_Staff_Survey_Final_Report.pdf highlights key areas that still need attention to ensure families can access quality, affordable early learning and child care. Important positive steps have been made, including “regular wage increases, pedagogical support staff, access to post-secondary courses, and the introduction of a pension plan and health benefits.”41 Flanagan, K. and Associates. (2025). Op. Cit., p. 77. One key challenge is finding ways to “introduce flexible workplace options in order to support staff in better balancing their work/family responsibilities,”42Flanagan, K. and Associates. (2025). Op. Cit., p. 78. as well as for centres to hire substitute staff. Retaining and recruiting early childhood educators is key to expanding quality child care for all who need it across P.E.I. and elsewhere.
Understanding P.E.I.’s 2026 living wage beyond the budgetary costs
In 2025, the rates remained the same, with some costs barely changing, including transportation, and only slight increases in food, clothing and footwear, and a notable decline in child care costs. While rent costs increased on P.E.I. in 2025, they did not grow as much as in previous years, and families with children could access the newly introduced P.E.I. child benefit (notable for its higher income eligibility cut-off than the other Atlantic provinces). In 2025, this small new income transfer, combined with some provincial and federal tax changes, offset the small changes in budgetary expenses on P.E.I..
In 2026, the new P.E.I. Essentials Benefit, which replaces the Prince Edward Island Sales Tax Credit, has a guaranteed minimum for all households regardless of income, and it has also slightly expanded income thresholds for benefits, allowing living-wage households to receive some benefits, but they remain small (for example our model families in Charlottetown and P.E.I rural receive only $15.21 per month, or $182.50 annually, the maximum benefit is $365 per year for couples and single-parent families with incomes below $95,000).
In 2026, Prince Edward Island also slightly enhanced the provincial child benefit. This transfer, introduced in January 2025, undoubtedly helps some families, but only a little. The low monthly amounts of between $24 and $34, depending on net income, will have some positive effects.43 Government of Prince Edward Island. (2024). “PEI Child Benefit.” www.princeedwardisland.ca/en/information/social-development-and-seniors/PEI-child-benefit Given that the adjusted living wage household incomes this year are just under $75,300 and $78,800, they are only eligible for $44 a month.
In P.E.I., unlike in other provinces, gross employment income is lower than the annual costs (family expenses) it needs to cover. This is because the increase in transfers supplemented the employment income, and the combined tax reductions meant a slightly smaller increase in government deductions.
P.E.I. again shows that small changes can make a difference; the new P.E.I. Essentials Benefit and enhanced P.E.I. Child Benefit, combined with federal benefits, can help reduce the employment income required to cover household expenses. However, those benefits remain inadequate, and more is needed to ensure people can access the services they need. We commend P.E.I. for introducing a new high-income tax bracket, and urge the government to carefully reconsider any further tax cuts; the opportunity cost of lost revenue could do more for households that are really struggling, with further investments in child care, health care, and transportation as we outline in the final section of this report.
Policy recommendations to build economic security
Wages and working conditions
First, this report calls for employers to pay a living wage.
All private- and public-sector employers should pay their employees, whether directly employed or on contract, at least a living wage. Governments, in particular, should not contribute to the problem by paying poverty wages. Government budgets are affected by the high costs of poverty, whether through lost productivity or the pressure to help people live on low incomes. Municipalities should be living-wage employers, as should hospitals and other public bodies. All public procurement should include provisions to ensure contract workers receive a living wage. Moreover, governments must ensure grant agreements with non-profit service providers provide enough to pay employees a living wage. Entire segments of our economy include workers who provide vital publicly funded services, such as home care workers and early childhood educators, yet do not earn a living wage.
Private employers must also recognize that the more generous government programs, services, and income transfers are, the less income workers need to cover their costs. Social programs, redistribution and government investments would also help address this problem. Private-sector employers should pay living wages and help working households manage the rising cost of living through improved universal services and programs, and investments in public infrastructure. Employers should also understand the evidence on the benefits they can reap when their workers earn a living wage and are less stressed, happier, and healthier.
Recommendations:
- All employers should pay at least a living wage.
- All levels of government should ensure that all direct and contract employees are paid at least a living wage and include a living-wage provision in all public procurement.
Raising the minimum wage
Workers in the Atlantic provinces bring home some of the lowest wages in the country. One in five workers in Atlantic Canada earns less than $20 an hour, and minimum wages in the region range from $15.90 to $17.30 an hour.44 Own estimates using Statistics Canada’s Labour Force Survey Public Use Microdata Files (PUMF), January–September 2026.
Historically, minimum wages have been too low to cover basic living costs. Workers in industries where minimum wages dominate have been hit hard by recent inflation. The real value of minimum wages in Canada peaked in the late 1970s and then stagnated for decades, failing to keep pace with the cost of living.
A significant minimum wage increase is a crucial response to the living wage gap.45 See the submission to P.E.I.’s Employment Standards Board: Saulnier, C. (2026). “Closing the gap to the living wage: Prince Edward Island needs to stay the course.” CCPA Nova Scotia and the MacKillop Centre for Social Justice. www.policyalternatives.ca/news-research/closing-the-gap-to-the-living-wage-prince-edward-island-needs-to-stay-the-course/
Arguments against raising the minimum wage lack empirical support.46 Saulnier, C. and Thompson, K. (2024). Atlantic Canadians need a raise: One-third of Workers Earn Less than $20 an hour. CCPA Nova Scotia. www.policyalternatives.ca/news-research/atlantic-canadians-need-a-raise-one-third-of-workers-earn-less-than-20-an-hour/ Since the 1990s, real-world evidence shows that even significant minimum wage increases have little to no effect on job losses.47Card, D. & Krueger, A. (1993). Minimum Wages and Employment: A Case Study of the Fast Food Industry in New Jersey and Pennsylvania. National Bureau of Economic Research. www.nber.org/papers/w4509 In Ontario, a substantial minimum wage increase led to employment growth even in sectors known for low wages and precarious work; overall unemployment fell, wages rose, and racialized workers saw significant gains in particular.48Block, S. and Galabuzi, G-E. (2022). One Step Forward: Assessing the labour market impacts of Ontario’s 2018 minimum wage increase. CCPA. www.policyalternatives.ca/news-research/one-step-forward/
As for inflation, businesses pass on only a fraction of higher labour costs through higher prices; the extent depends largely on supply and demand, not a simple cause-and-effect relationship. Broader macroeconomic factors overwhelmingly determine costs and employment levels.
Raising the minimum wage reduces income inequality (including gender and racial inequalities). We cannot underestimate the positive impacts of a living wage on workers’ health and their ability to bring their best to the workplace—nor the negative impacts of a low-wage economy on government revenue and expenditure, or on our society.49 Saulnier, C. (2022). The impact of a low-wage economy on government revenue and expenses. Submission to the Standing Committee on Public Accounts. CCPA Nova Scotia. policyalternatives.ca/sites/default/files/uploads/publications/Nova%20Scotia%20Office/2022/06/LowwageeconomyCCPANSSubmissionPublicAccounts.pdf
Recommendation:
- Provincial governments should significantly raise minimum wages and ensure that all workers are paid at least the same provincial minimum wage.
Improve working conditions
Living wages are only part of creating decent working conditions. Governments must better protect and support workers’ fundamental rights to organize and influence their working conditions, improving productivity while making workplaces safer and healthier.
Respect for collective bargaining is crucial to restoring the balance. However, unionization rates have been stagnant for some time, and governments need to remove barriers to make it easier for workers to exercise these rights.50 Brickner, R.K., Casey, R. Harrington, R. and Cerdas Sandí. (2026). “One of the hardest places to organize in the country”: Understanding and overcoming barriers to unionization in Nova Scotia. CCPA Nova Scotia. www.policyalternatives.ca/news-research/adw-understanding-and-overcoming-barriers-to-unionization-in-ns/
Paid leave provisions need to be updated to support parents caring for sick children and to ensure workers are not forced to go to work while sick for fear of losing wages if they stay home. At a minimum, workers deserve paid sick days. Workers also deserve greater coverage for statutory holidays and additional paid leave for personal time.
Provincial governments in Atlantic Canada should extend labour standards to all exempt workers and enforce them proactively. Modernizing labour standards would help ensure workers are safe, healthy, and as productive as possible by supporting them in bringing their best to work.51 Casey, R. and Saulnier, C. (2025). The Foundations of Decent Work: An Evaluation of Nova Scotia Labour Standards. CCPA Nova Scotia. www.policyalternatives.ca/news-research/the-foundations-of-decent-work-an-evaluation-of-nova-scotia-labour-standards/ Provincial governments must also strengthen pay equity, extend it to the private sector, not just the public sector, and enact pay transparency legislation.52Cerdas Sandí, D. and Saulnier, C. (2026). Closing the gaps. Op. Cit.
Recommendations:
- Provincial governments must strengthen labour standards to better protect workers’ health, safety, and work-life balance, and enforce them proactively.
- Provincial governments must also strengthen pay equity, extend it to the private sector (not just the public sector), and enact pay-transparency legislation.
- Collective bargaining is an important way to determine wages; as such, governments should remove barriers to unionization to improve workers’ say over their wages and their work.
Government taxes and transfers
Governments need to do more to support low-income working households. Transfers designed, in theory, to help low-income people often don’t reach the households that need them most.
For example, the Canada Child Benefit (CCB) has helped households with children, providing a decent transfer amount adjusted for the previous year’s high inflation, and it phases out completely at annual incomes higher than those of living-wage households. Household income phase-out thresholds are much lower for other federal transfers, including the old GST credit and new Canada Groceries and Essentials Benefit, as well as most provincial programs except for the P.E.I. Essentials Benefit and P.E.I. Child Benefit (both of which are small transfers). The new Canada Groceries and Essentials Benefit does have a higher maximum income threshold ($73,592, for married or common law individuals with 2 children)53 Government of Canada. (2026). “Canada Groceries and Essentials Benefit (CGEB).” www.canada.ca/en/revenue-agency/services/child-family-benefits/canada-groceries-essentials-benefit/who-eligible.html and therefore the living-wage households on P.E.I. both access a small amount of that rebate.
Crucially, the actual allowable benefit under the CCB is reduced once a household’s adjusted family net income exceeds $38,237. For example, our reference household, based on a conservative measure of the bare minimum a family needs to earn, does not qualify for the full benefit. This threshold is too low. It undermines the purpose of the CCB, and the federal government should adjust it. However, the CCB is the only transfer for which all the reference households in our calculation qualify, because it includes a further reduction for households with incomes of $82,847 but does not fully phase out for these households.
One transfer that made a difference was the Canada Carbon Rebate, designed to offset the federal fuel charge. Despite the rhetoric surrounding it, the Rebate, based on where you live and household size (not income), helped low-income households, in particular, deal with cost-of-living increases. In our calculations, the carbon rebate amounts, including the carbon rebate rural supplement, made a significant difference in the 2024 calculation and last year’s calculation (though it phased out in April 2025). All households in our calculations had access to the full rebate without clawback;54 The rebate per quarter was: $149 per individual, plus $74.50 for a spouse or common-law partner; $37.25 per eligible child under the age of 19, and $74.50 for the first eligible child in a single-parent family; and rural residents received 20 per cent more of the base. as incomes rose, it had a large positive effect for these households (who also tend to be lower polluters given consumption patterns).
Provinces offer superficially similar benefits, but they do little to reach the households that need them. Prince Edward Island’s new child benefit is quite small, but more families qualify there because of the higher income eligibility cutoff. Potential benefits are higher in Newfoundland and Labrador and Nova Scotia, but the income eligibility threshold is a fraction of the living wage. Policies like these can help working families, but only a small fraction.
There is little to no support for households without children — low-income people who cannot afford children in the first place do not get much attention from the government. In theory, the Canada Workers Benefit could help working single adults, but most low-income people working full-time just don’t qualify—the threshold is too low; the net income threshold is $27,392 and phases out entirely at around $38,492 (for 2026).55 Government of Canada. (2026). “Indexation adjustment for personal income tax and benefit amounts.” www.canada.ca/en/revenue-agency/services/tax/individuals/frequently-asked-questions-individuals/adjustment-personal-income-tax-benefit-amounts.html
We need a more progressive income and wealth taxation system to ensure sufficient government revenue to support income transfers and expand public programs. We should also ensure that our tax system is responsive to the reality of what income levels are needed to afford essentials and thus does not penalize low—and middle-waged workers. A redistributive tax system helps households below the living wage by increasing after-tax household income.
This year, our reference households benefited slightly from changes to federal and provincial taxes, which illustrates the key point: progressivity helps. Federal and provincial governments could do much more to use this tool to combat inequality and reduce the gap between what people earn and what they need to earn.
It is also important to note that, while politically popular, calls for “across-the-board” tax cuts are not the mechanism that will make a significant enough difference for those who are struggling. They drain revenue needed to fund public programs that help keep the cost of living down, and the major beneficiaries of those tax cuts are high-income earners who are not struggling with the costs of life’s essentials.56 See: Cerdas Sandí, D. and Saulnier, C. (2026). “Who Really Benefits from Nova Scotia’s Tax Cuts?” CCPA Nova Scotia. www.policyalternatives.ca/news-research/who-really-benefits-from-nova-scotias-tax-cuts/ ; and Cerdas Sandí, D. Saulnier, C., and Williams, R. (2026). Op. Cit. www.policyalternatives.ca/news-research/nl-value-of-public-spending/
While many things could make the tax system fairer, measures that target low- and middle-income households through enhanced progressivity or targeted transfers could help considerably from a living-wage perspective. Sales tax credits should more effectively support these households. P.E.I. is the only province that has introduced tax changes for higher income households and whose tax credit reaches the living-wage households.57 In 2026, P.E.I. introduced a new tax bracket for $200,000 income at 20 per cent, see: Government of Prince Edward Island. (2026). “Provincial Personal Income Tax.” www.princeedwardisland.ca/en/information/finance-and-affordability/provincial-personal-income-tax
Recommendations:
- Provincial and federal governments should carefully assess income phase-out thresholds and claw-back levels for existing household supports to expand access and increase amounts, taking annual living-wage incomes into account.
- Improve the progressivity of taxation systems.
Public services
Housing
Shelter costs, our measure for housing expenses in the reference household, include rent and utilities in our calculations. They are the most expensive items in living wage calculations and make up the largest share of living wage budgets across the Atlantic region. Housing costs have become a crisis requiring much greater attention.
Atlantic Canada has long neglected affordable housing. Housing action requires cooperation across all levels of government and must focus more on supporting the construction of affordable rental housing; public, non-market housing is vital to dampening housing-cost inflation. Sadly, while federal governments neglect this key housing response, even where funding is available, municipal governments in the region seem to struggle to approve the construction of this type of housing. Every level of government is failing this test.
Governments also need to explore options commonly used to limit the frequency and level of rent increases. Where such systems exist in Atlantic Canada (Nova Scotia, New Brunswick and P.E.I.), they aren’t currently designed to work as effectively as they can.58 See The Monitor’s six part series on rent control: www.policyalternatives.ca/news-research/policy-solutions-and-political-responses-to-fix-ontario-rent-control/ Our recent submission to P.E.I. called for a rental freeze;59 Leviten-Reid, C. and Saulnier, C. (2026). “Housing is a human right: P.E.I. renters deserve a break.” CCPA Nova Scotia Submission to P.E.I. Residential Tenancy Office. www.policyalternatives.ca/news-research/housing-is-a-human-right-pei-renters-deserve-a-break/ renters have not had a break for a very long time.
Recommendations
All provinces should:
- Invest in rental subsidy support as a critical, immediate (temporary) policy to help renters who spend more than 30 per cent of their income on housing.
- Institute vacancy control that caps annual increases to once every 12 months for any unit, and freezes rent for at least a year.
- Use legislative changes and funding to support tenants’ organizing efforts, ensure landlords are licensed, and proactively enforce tenants’ rights to prevent renovictions and tenant displacement.
- Substantially increase funding for affordable housing, directed to the public and community (non-profit and co-operative) housing sectors, with a plan that sets targets to eliminate homelessness and meet core housing needs.
Child care
Child care is the fourth most expensive item in most regional budgets across the three provinces. The budgets include full-time licensed child care for a toddler plus “wraparound” before- and after-school care for a seven-year-old. These costs do not reflect availability, which is a serious concern across the Atlantic region, most severely in Newfoundland and Labrador. In some places, people just can’t get child care.
In 2021, the federal government announced the historic Canada-wide Early Learning and Child Care (CWELCC, or the $10-a-day plan) and significant multi-year funding. By March 2022, the federal government had signed bilateral agreements with each province and territory. These agreements aimed to develop a child care system based on the principles of “affordability, accessibility, quality, flexibility, and inclusivity,” as outlined in the first Canada-wide child care legislation passed into law in March 2024.60 Bill C-35, An Act respecting early learning and child care, 1st Sess, 44th Parl, Canada, 2024. www.parl.ca/DocumentViewer/en/44-1/bill/C-35/royal-assent The initial goal of these plans was to reduce parent fees for child care by 50 per cent (on average) by December 2022, using 2019 as the baseline year for fees. The second target was to lower parental fees to an “average of” $10 a day by April 2026. Each bilateral agreement also sets targets for the number of licensed spaces to be created, along with coverage-rate goals for children under 6.61 Government of Canada. (2025). “Early Learning and Child Care Agreements.” www.canada.ca/en/early-learning-child-care-agreement/agreements-provinces-territories.html
P.E.I. is the furthest along in meeting all targets, with important expansion.62 Macdonald, D., & Friendly, M. (2025). The price is not right (yet). Op. Cit.; Macdonald, D. (2025). Cash Cow. Op. Cit. A primary concern is that the P.E.I. system has the highest concentration of for-profit licensed care, which increases the risk of closures or sales to multinational corporations. Although for-profit enterprises are mostly funded with public money, they can still close or sell their business.
Nova Scotia has not yet reached its coverage target, so families still face a market system where they pay high fees. To reach the 50 per cent reduction target, Nova Scotia provided funding in December 2022 at a flat rate based on 2019 average fees, and it has not increased since. However, some families do receive additional subsidies.63The adjusted income is $70,000, while some of the households may qualify for a small subsidy, the family also has to find regulated child care space. See: Government of Nova Scotia. (n.d.) “Nova Scotia Child Care Subsidy Program.” childcarenovascotia.ca/families/child-care-subsidy Nova Scotia is one of the few provinces that still has market-based fees, which vary significantly by centre, region, and age.64 Macdonald, D. and Friendly, M. (2026). The $10-a-day divide: Child care fees in Canada in 2026. CCPA. www.policyalternatives.ca/news-research/the-10-a-day-divide-child-care-fees-in-canada-in-2026/
Newfoundland and Labrador reached the $10-a-day target before the deadline, providing funding to licensed care providers that replaces the amount parents would have paid in fees above $10, with other low-income families also receiving further subsidies. However, parents still face a shortage of new child care spaces, leaving many families struggling to find and afford care outside licensed facilities.
All these provinces allowed unsustainable, uncertain stability with too many for-profit spaces. There were several bankruptcies and concerns about further sales in Newfoundland and Labrador,65 Child Care Now Newfoundland and Labrador. (2026). “Pitter Patter is an opportunity for government to expand public child care in Newfoundland and Labrador.” nl.childcarenow.ca/2026/04/13/pitter-patter-is-an-opportunity-for-government-to-expand-public-child-care-in-newfoundland-and-labrador/ as well as sales to a French child-care multinational operator in Nova Scotia.66 Kid & Company. (2026). “Kids & Company Announces Acquisition of Friends for Life Childcare, Expanding Early Learning Presence in Nova Scotia.” Press release. kidsandcompany.com/press-release/kids-company-announces-acquisition-of-friends-for-life-childcare-expanding-early-learning-presence-in-nova-scotia/ Nova Scotia should take note of these lessons, with real estate speculators looking for property.
The new federal government, led by Prime Minister Carney, signed additional federal funding and new five-year bilaterals with each Atlantic province (to the end of 2027). However, these were framed as agreements to maintain the spaces, fees, and wages, as they are currently.67 Child Care Now. (2026). “Spotlight on public delivery of licensed child care in Canada.” childcarenow.ca/2026/05/27/spotlight-on-public-delivery-of-licensed-child-care-in-canada/
The living wage calculations underline why systematic, centrally planned, and federally and provincially funded support is needed to build a non-profit, public, quality, affordable, accessible child care system year-round that meets the needs of diverse families in every community. The expansion cannot be left to request for proposals from overworked child care directors or volunteer boards of non-profit centres. Provincial targets should not replace community- and neighbourhood-level targets and planning. A publicly led, appropriately funded expansion is needed, much like we see in the K–12 school and health care systems. While rural density is a challenge, except in Newfoundland and Labrador, all children in the Atlantic region live within 10 kilometres of an elementary school, which could serve as a site.68 Macdonald, D. (2025). Cash Cow. Op. Cit. Capital, public planning, and funding for better wages and benefits to recruit and retain the workforce needed to staff new spaces will all be required.
Ensuring all families can access affordable child care remains one of the most tangible ways to reduce the required living wage; even $10 is not affordable for some families. Governments must commit to sustained investment to expand access to quality, licensed, regulated, non-profit universal care in communities across all provinces. Quebec implemented a universal program in the late 1990s, and researchers continue to show its tremendous impact. For example, for every dollar invested in early childhood education, the broader economy returns between $1.50 and $2.80.69 Montpetit, S., Beauregard, P-L., & Carrer, L. (2024). A welfare analysis of universal childcare: Lessons from a Canadian reform. childcarecanada.org. childcarecanada.org/documents/research-policy-practice/24/07/welfare-analysis-universal-childcare-lessons-canadian
Early learning and child care is essential social infrastructure and critical for children’s development. Importantly, we can’t expand access to child care without more Early Childhood Educators (ECE), and we risk reducing quality if we don’t ensure they are properly supported financially through income, pensions, and health benefits—and retain those we have. For recruitment and training, we need to bolster public postsecondary options rather than ‘streamlining’ training and placing a much heavier supervisory load on educators already facing short staffing. Investment in expansion must put educators’ working and learning conditions at the forefront to retain and recruit these educators.
Recommendations:
- Central planning and new funding models are needed to sustain long-term investment in non-profit child care to ensure families can access a public system that provides high-quality, licensed, regulated, non-profit, universal care in communities across all provinces and regions.
- The 59 per cent coverage rate is inadequate and should at least reflect the reality for most working families. Child care should be seen as an investment in children, and ideally, universal coverage should be the target, as with public schools.
- More investment is needed to retain current ECE workers and recruit new ones through publicly funded wage grids that guarantee decent wages and benefits for all early childhood educators.
Health care
The living wage budget includes the cost of a basic private health insurance plan. This insurance covers health-related expenses such as dental care and prescription drugs not covered by public health care in all three provinces. Households must still pay deductibles and the remaining cost after insurance, which this budget assumes are covered under household expenses.
This budget item is a modest estimate and would not be adequate for families with significant medical expenses, such as households where one or more family members have a severe health condition or a disability requiring expensive equipment or medications.
The Canada Dental Benefit is not a universal program for the entire household and thus was not included in our calculations. A universal dental care program would reduce out-of-pocket expenses and be the most cost-efficient way to address inequities in access for all.70 Doucet, B. (2023). About Canada: Dental Care. Fernwood Publishing. fernwoodpublishing.ca/book/about-canada-dental-care The first full year for all eligible Canadians is 2025, and for some, it will mean affordable dental care and lower insurance costs.
Similarly, pharmacare initiatives are also potentially important. Helping people with prescription drug costs is a good idea, but the federal government’s limited investment in a partial national pharmacare plan (covering contraception and diabetes treatments for provinces that signed on before the last election, including P.E.I.) is limited. While some provinces also offer limited pharmacare options for very low-income populations, these programs do little for most households earning a living wage, they simply don’t qualify. Essentially, government pharmacare programs are a patchwork; a simple, fully funded universal system would be better, costing all households less and providing better benefits.
Canadians know what Medicare does for them, and expanding efficient, universal health care is one way to reduce the cost of living. We need to learn from what we already know.
Recommendations:
- Stop privatizing health care and end the patchwork that only builds onto the existing market system.
- Expand universal public health care to cover full, free access to dental care, prescription drugs, mental health, eye care, hearing aids, assistive devices/products, and harm reduction support for substance use disorders and drug use.
Post-secondary education
Post-secondary education is vital to helping people move out of low-waged employment. Employers and governments also worry about skills shortages, but “up-front” costs (tuition in particular) have risen, reducing access across the region. Affordable public education has been a key part of Canada’s economic strategy for decades; it’s an economic ladder, and it’s unclear why governments want to kick that ladder out from under young people, while straddling them with debt.
Recommendation:
- Remove barriers to post-secondary education, reduce or eliminate tuition fees, and adequately fund public universities and colleges.
Ensuring Fair Prices
Food insecurity is inadequate or insecure access to food due to financial constraints. Generally, rates of food insecurity have been higher in Atlantic Canada than in other parts of the country and markedly high in Newfoundland and Labrador and P.E.I..
The main way to address food insecurity is to address income insecurity using the solutions we have outlined above. A broader “food security strategy” is needed to address the root causes of food insecurity.71 Food First N.L. (2018). Annual Report 2018, From 1998 to 2018, Celebrating 20 Years. static1.squarespace.com/static/54d9128be4b0de7874ec9a82/t/5c080228c2241b25cb339347/1544028766773/Annual+Report+2018+%28PDF%29.pdf This strategy should include funding to encourage more local food production and reduce dependence on expensive imports from large grocery chains, which could improve affordability and access.
Governments could do more than just talk about “greedflation.” Canada, and Atlantic Canada in particular, does not have a competitive grocery market. Every Canadian who goes to the grocery store has reason to question whether they are getting a fair deal.
Similar cost challenges exist in other vital services. Households cannot participate in the economy or society without internet and phone services. Canadians pay some of the highest costs in the world for these services. Much like groceries, governments could do more to reduce those prices by using their regulatory power. Governments know this is a problem, and they know limited options for alternative services in some regions need to be addressed, but their response is a patchwork.
Recommendations:
- Invest in local, sustainable, affordable food production and distribution, and address food insecurity by improving income security.
- Use legislative and regulatory tools to combat anti-competitive practices and price gouging.
- Tackle the digital divide by expanding programs that support low-income households’ access to affordable internet and phone services.
- Take steps to ensure that household costs for these essential services are fair and reasonable.
Evidence-based decisions
The living wage calculations use the best available data that provides the most realistic and reliable cost estimations possible but the data is often inadequate. However, governments could address these limitations. Provinces could increase provincial data collection and request oversampling for certain Statistics Canada data.
One example of needed data is rent information, which is inconsistently available across the Atlantic region except in the Halifax Regional Municipality. Very few communities have rental rates available through CMHC’s data portal, while communities with populations less than 10,000 have no annual rental market data collected by CMHC. A better, more robust rental survey would also clarify what is, or isn’t, included in the rent (i.e., CMHC doesn’t specify whether its rental data include utilities).72 Leviten-Reid, C., Horel, B., Matthew, R., Deveaux, F. & Vassallo, P. (2019). Strong foundations: Building community through improved rental housing data. Journal of Rural and Community Development, 14(3), pg. 73-86. journals.brandonu.ca/jrcd/article/view/1689
Newfoundland and Labrador has developed its own Market Basket Measure that better captures that province’s local and regional realities, but it relies heavily on the Census. In some provinces, the dietician’s association regularly collects food-costing data, which is then used to calculate the living wage.73 Ivanova, I., French, A., & Oliveira, T. (2023). Op. Cit. The Prince Edward Island researchers who did the food costing in 2013 as a pilot concluded that “the cost of the P.E.I. Nutritious Food Basket should be monitored annually by the provincial government using standardized, valid methods. Annual reports should be made available to the public.”74 Walton, C. & Taylor, J. (2013). Prince Edward Island Pilot Food Costing Project Report. University of Prince Edward Island & Prince Edward Island Food Security Network. PEIfoodsecurity.wordpress.com/wp-content/uploads/2013/11/uPEI-fsn-food-costing-report-nov-21-2013.pdf Nova Scotia supported participatory food costing for many years, but public funding ceased.
Recommendation:
- Invest in more provincial, local, and regional research to make more robust, disaggregated, and timely data on the costs of essentials available to inform policy decisions.
Conclusion
Many labour force problems in Atlantic Canada, including worker shortages in key areas, are fundamentally a problem of low wages. A generation of blaming workers’ demands for decent pay for societies’ economic woes has created a situation where workers cannot pay their bills, and employers cannot find workers.
As a key cost-of-living measure, the living wage is a benchmark that helps workers fight for pay increases that respond to inflation’s real-world impacts.
Governments can do a great deal to help workers not only live to work, but work to have a decent life. Action is needed beyond short-term relief from high costs; implement long-term solutions to address both the costs and income sides of the equation, while improving income and economic security by filling gaps in the social safety nets. Unless all levels of government act, many thousands of workers will continue to struggle to make ends meet.
Appendices
The technical briefs with data details for 2026 living wages for Newfoundland and Labrador, Nova Scotia, and Prince Edward Island are available below.
Acknowledgements
This report covers three provinces in Atlantic Canada. We acknowledge that Nova Scotia is the unceded, unsurrendered ancestral land of the Mi’kmaq people. Epekwitk (Prince Edward Island) is also located in Mi’kma’ki. We also acknowledge the island of Ktaqmkuk (Newfoundland) as the unceded, traditional territory of the Beothuk and the Mi’kmaq, and we acknowledge Labrador as the traditional and ancestral homelands of the Innu of Nitassinan, the Inuit of Nunatsiavut, and the Inuit of NunatuKavut.
About the authors
Daniel Cerdas Sandí
Daniel Cerdas (he/him) is a political scientist with a Master’s in Sociology and a Ph.D. in Social Science Research. He has over a decade of experience as a research and policy analyst, working at the intersection of labour rights and public policy. His work has focused on freedom of association, collective bargaining, international labour standards, gender equity, and informal work. Daniel has held roles with governments, unions, and international organizations, and is committed to advancing inclusive, evidence-based policy. At the Canadian Centre for Policy Alternatives-Nova Scotia (CCPA-NS), Daniel contributes to key projects including the Living Wage Reports for Nova Scotia, Newfoundland and Labrador, and Prince Edward Island; the Nova Scotia Productivity Report; the Nova Scotia Alternative Budget; and research on precarious work in the province.
Christine Saulnier
Christine Saulnier (she/her) is Director of the Canadian Centre for Policy Alternatives-Nova Scotia. She has a doctorate in Political Science from York University. She leads the living wage calculations for communities across Atlantic Canada and serves as a co-author of the annual child and family poverty report cards for Nova Scotia. She has written extensively, and given commentary on a range of other public policy issues including fiscal policy, labour markets, and child care policy. She serves on the Steering Committee of Child Care Now Nova Scotia, and Campaign 2000 (national coalition to end child and family poverty). She served on the Board of the NS Health Coalition and Adsum for 10 years.
Russell Williams
Dr. Russell Williams is an associate professor of political science at Memorial University. His research focuses on the intersection between international political economy and public policy. He is a co-author of Making Governance Work: Policymaking in the Era of Polarized Politics and has numerous publications, including articles in the Journal of Public Policy, Review of Policy Research, the International Journal of Public Sector Management, Canadian Foreign Policy, and Global Social Policy.
