More than a million workers in Ontario do not earn a living wage where they live—especially women and racialized workers.
We calculated this estimate using the 10 hourly living wage rates released by the Ontario Living Wage Network (OLWN) and applied them as a threshold across the province.
Using labour force data from Statistics Canada, we looked at the number of workers who were earning below this hourly wage threshold in 16 communities in Ontario. We used Census Metropolitan Areas (CMAs) where we had enough data availability to create meaningful estimates based on our income thresholds.1Estimates were carried using 2024 hourly living wage estimates and distribution of employed workers between July 2024 to June 2025 (12-month average)
The results? Nearly one in five workers (18 per cent) in Ontario cities earn less than a living wage.
We already know the effects of low-paying work. Employees who struggle to make ends meet may hold down multiple jobs. Or make difficult decisions about which bills to pay and which to fall behind on.
Many of these workers will be at the equivalent of full-time employment. Yet, unlike other workers, their week’s worth of work does not cover a week’s worth of living.
2024 living wage rates
Racialized workers
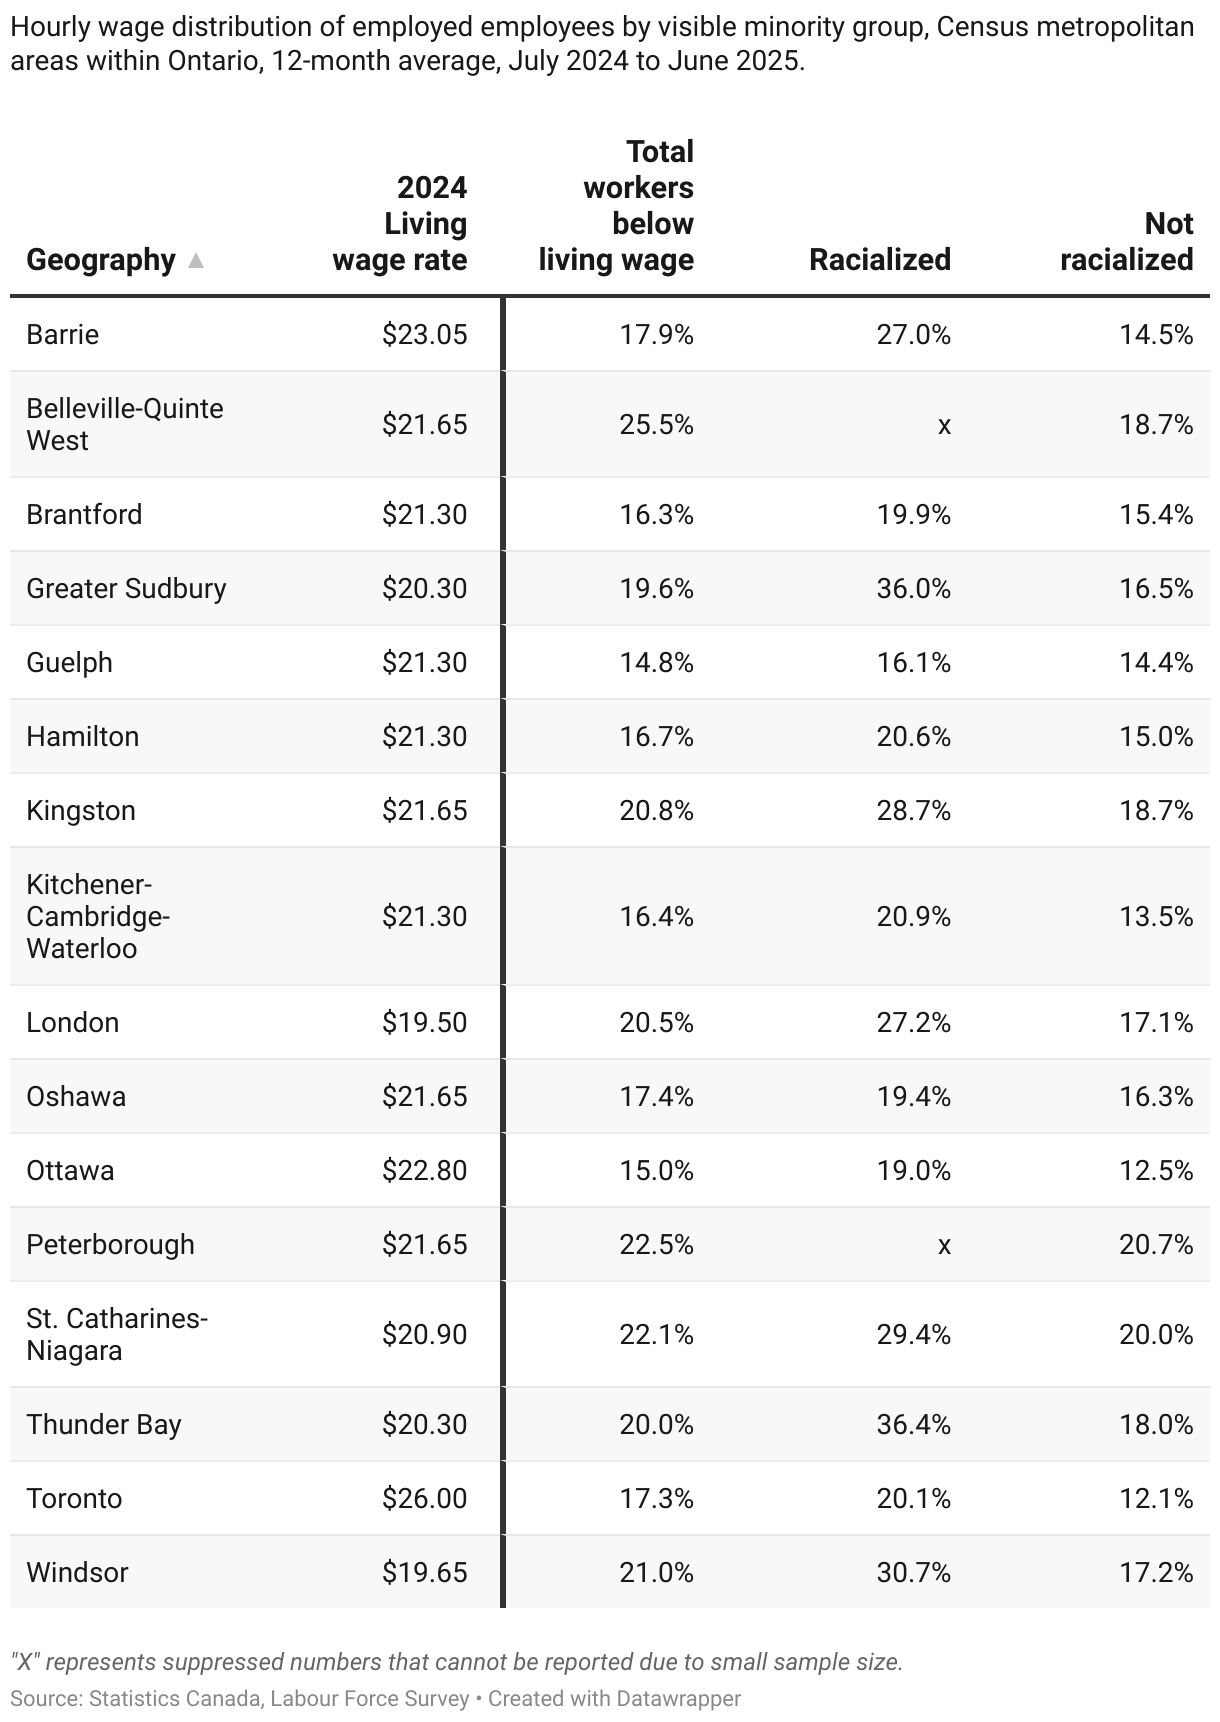
Racialized workers are more likely to earn less than the living wage in every city we examined, with most regions showing income gaps of seven to 10 percentage points between racialized and non-racialized workers.
Thunder Bay and Greater Sudbury have the third lowest living wage rate in Ontario. In Thunder Bay, 36.4 per cent of racialized workers earn less than the living wage, compared to 18 per cent of non-racialized workers.
In Greater Sudbury, a similar pattern emerges: 36 per cent of racialized workers earn less than the living wage compared to 16.5 per cent of non-racialized workers.
Windsor has the second-lowest living wage rate in Ontario. There, 30.7 per cent of racialized workers are below the threshold, compared to 17.2 per cent of non-racialized workers.
Table 1: Workers earning less than a living wage by racialization status
Below living wage workers, by gender
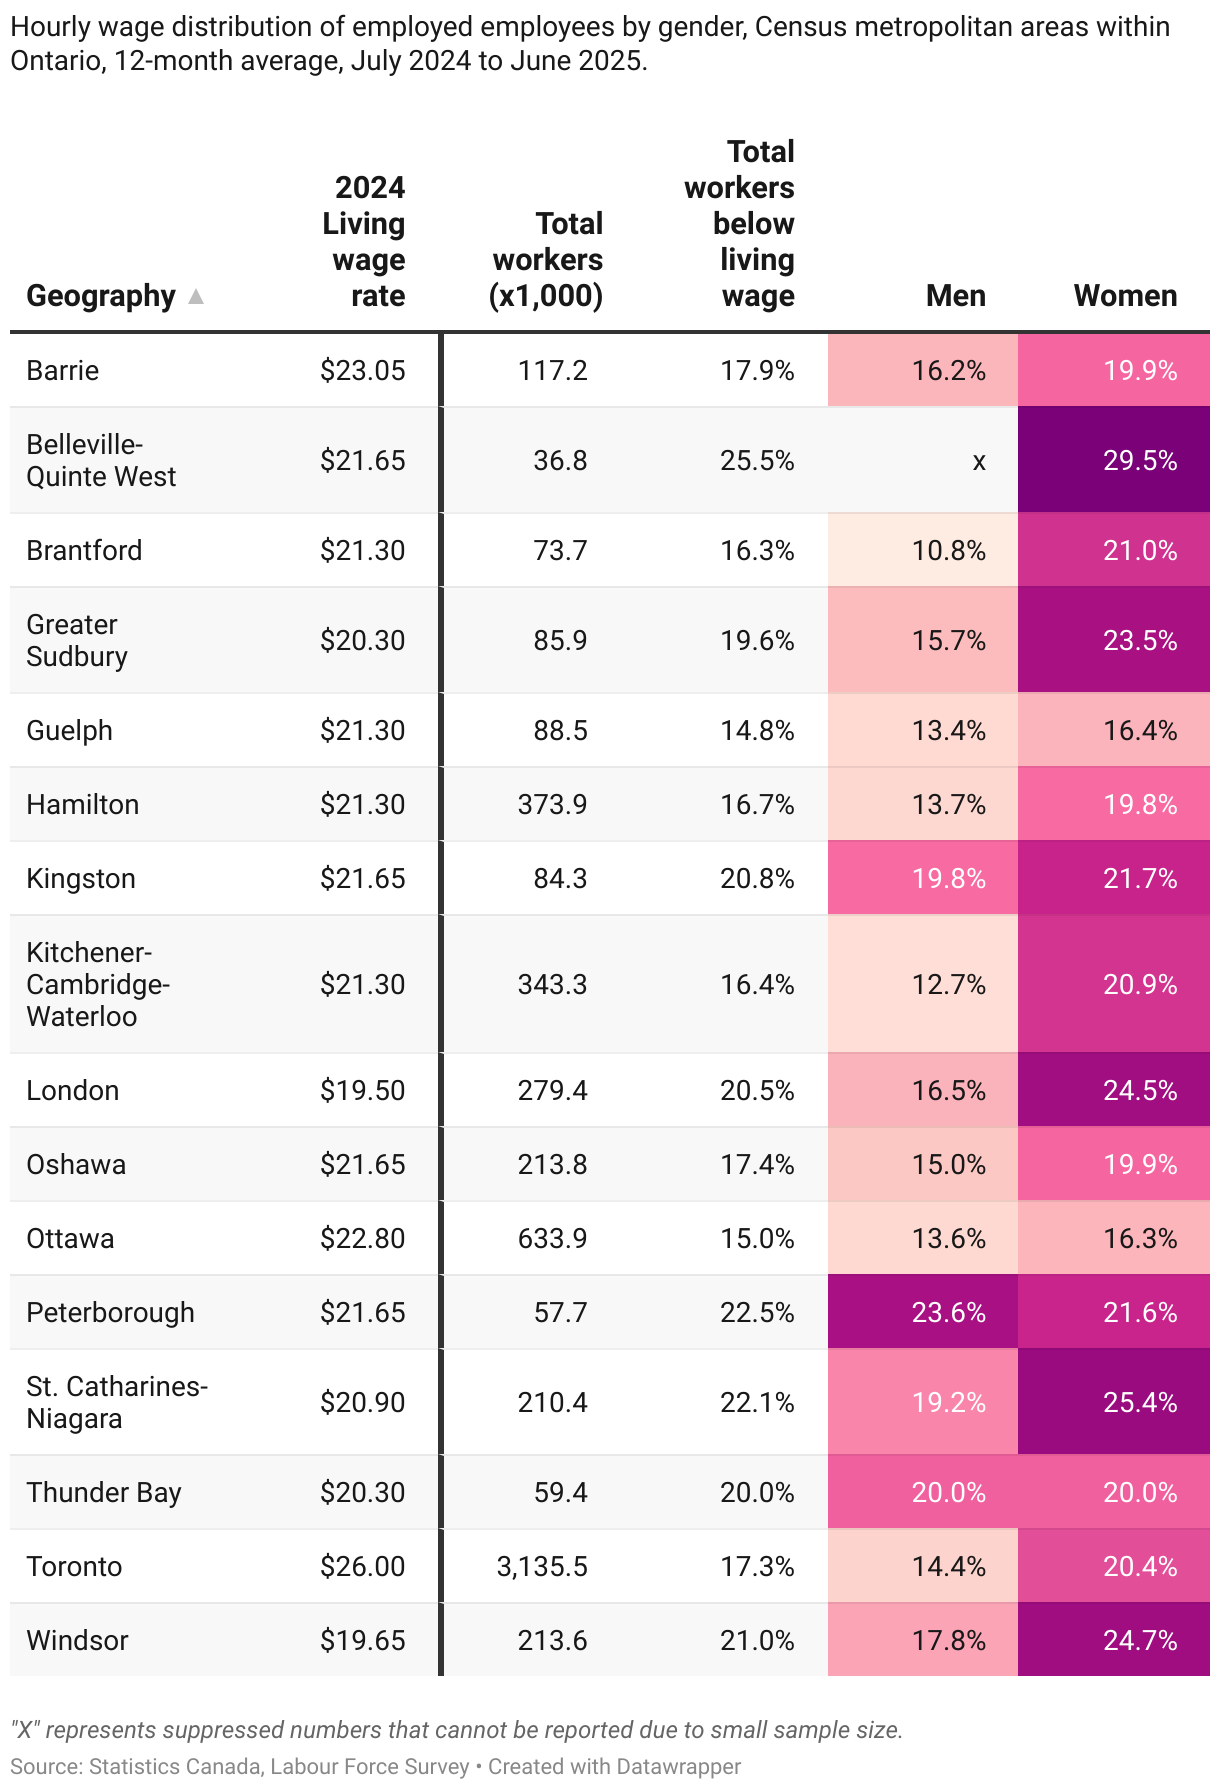
Across all cities in Ontario, women are more likely than men to earn less than the living wage.
Ottawa boasts the smallest gap: 16.3 per cent of women earn less than the living wage compared to 13.6 per cent of men, a difference of 2.7 percentage points.
Table 2: Workers earning less than a living wage by gender
Gender and race intersect
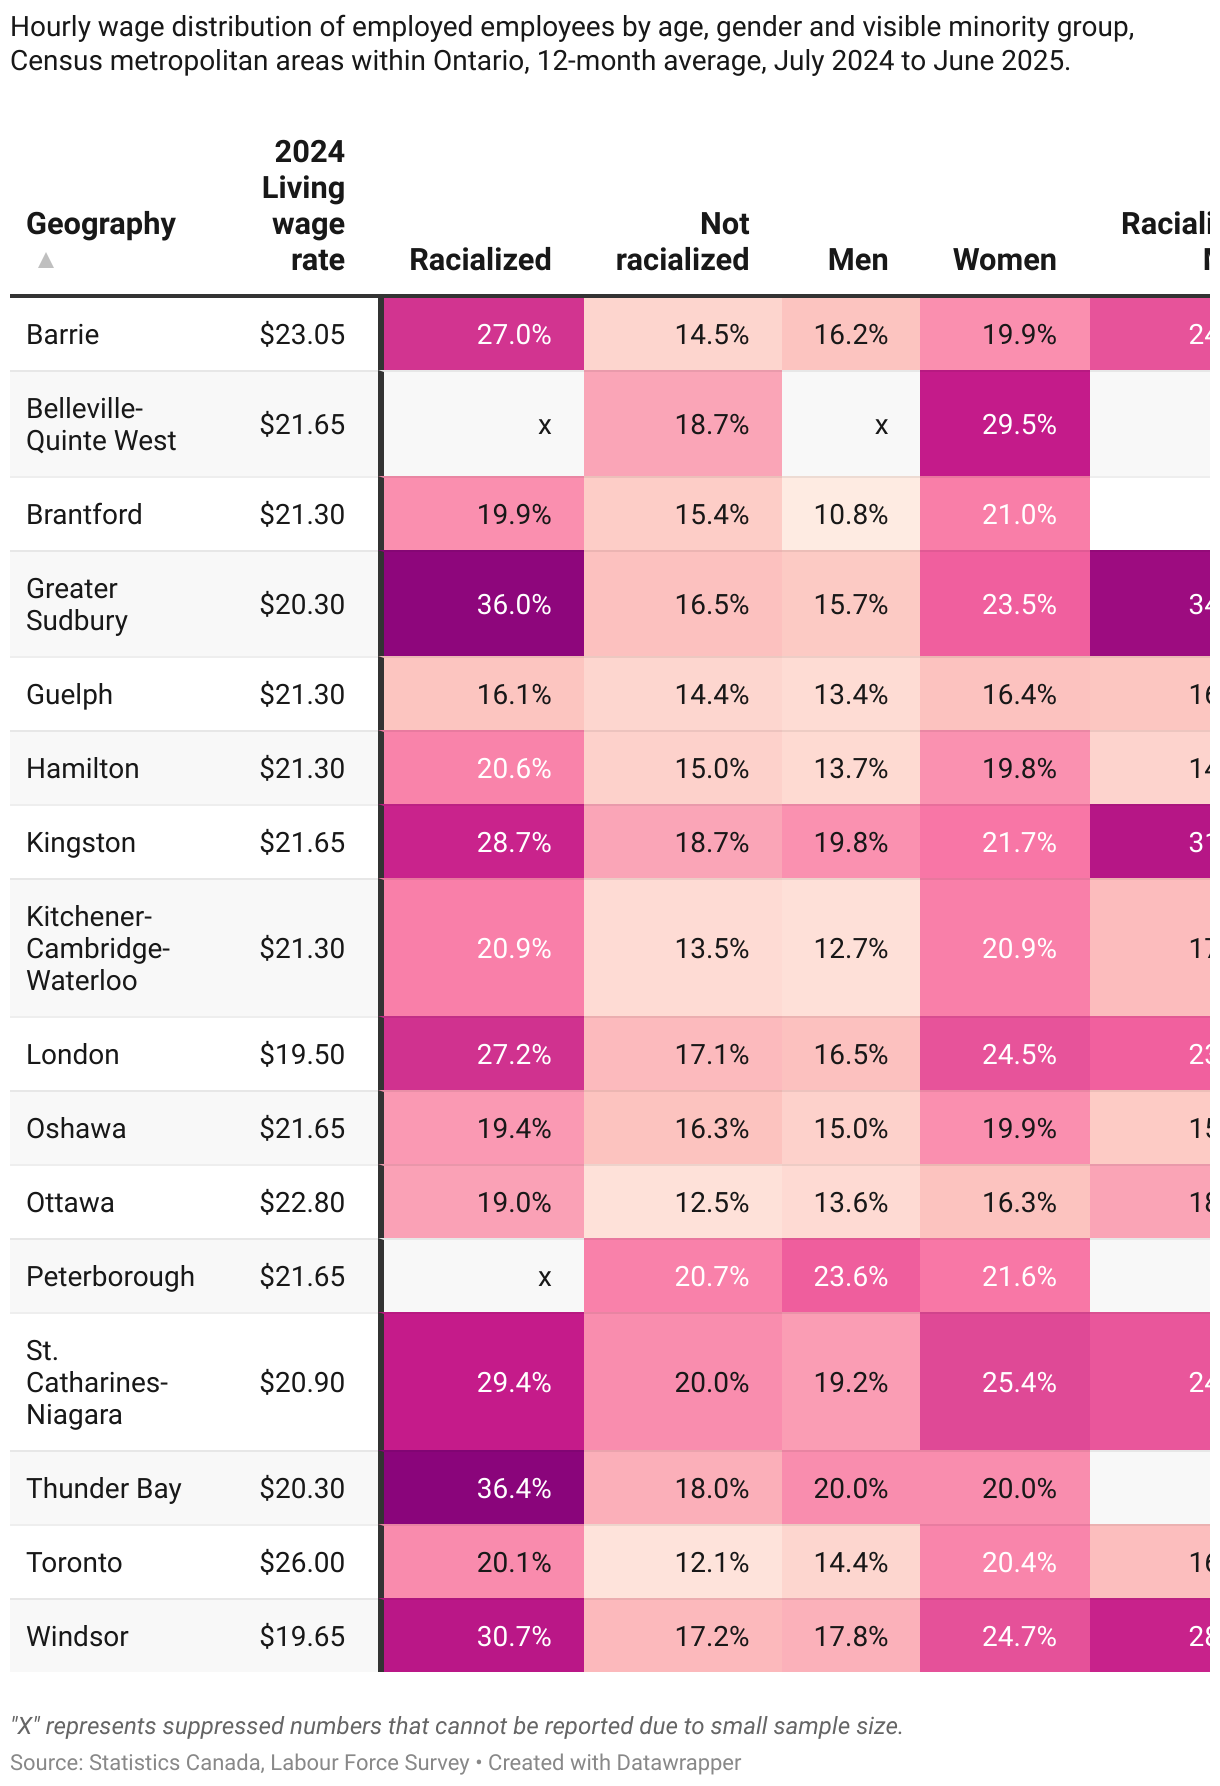
The intersection of gender and racial status compounds the disadvantage. Racialized women face some of the highest rates of below living wage employment in Ontario.
In Kitchener-Cambridge-Waterloo, Hamilton, London, Windsor, and St. Catharines-Niagara, 25 per cent of racialized women earn less than the living wage in their region.
In every city we examined, racialized men also face a higher likelihood of earning below the living wage compared to the general male population.
Table 3: Workers earning less than a living wage by city, racialization, and gender
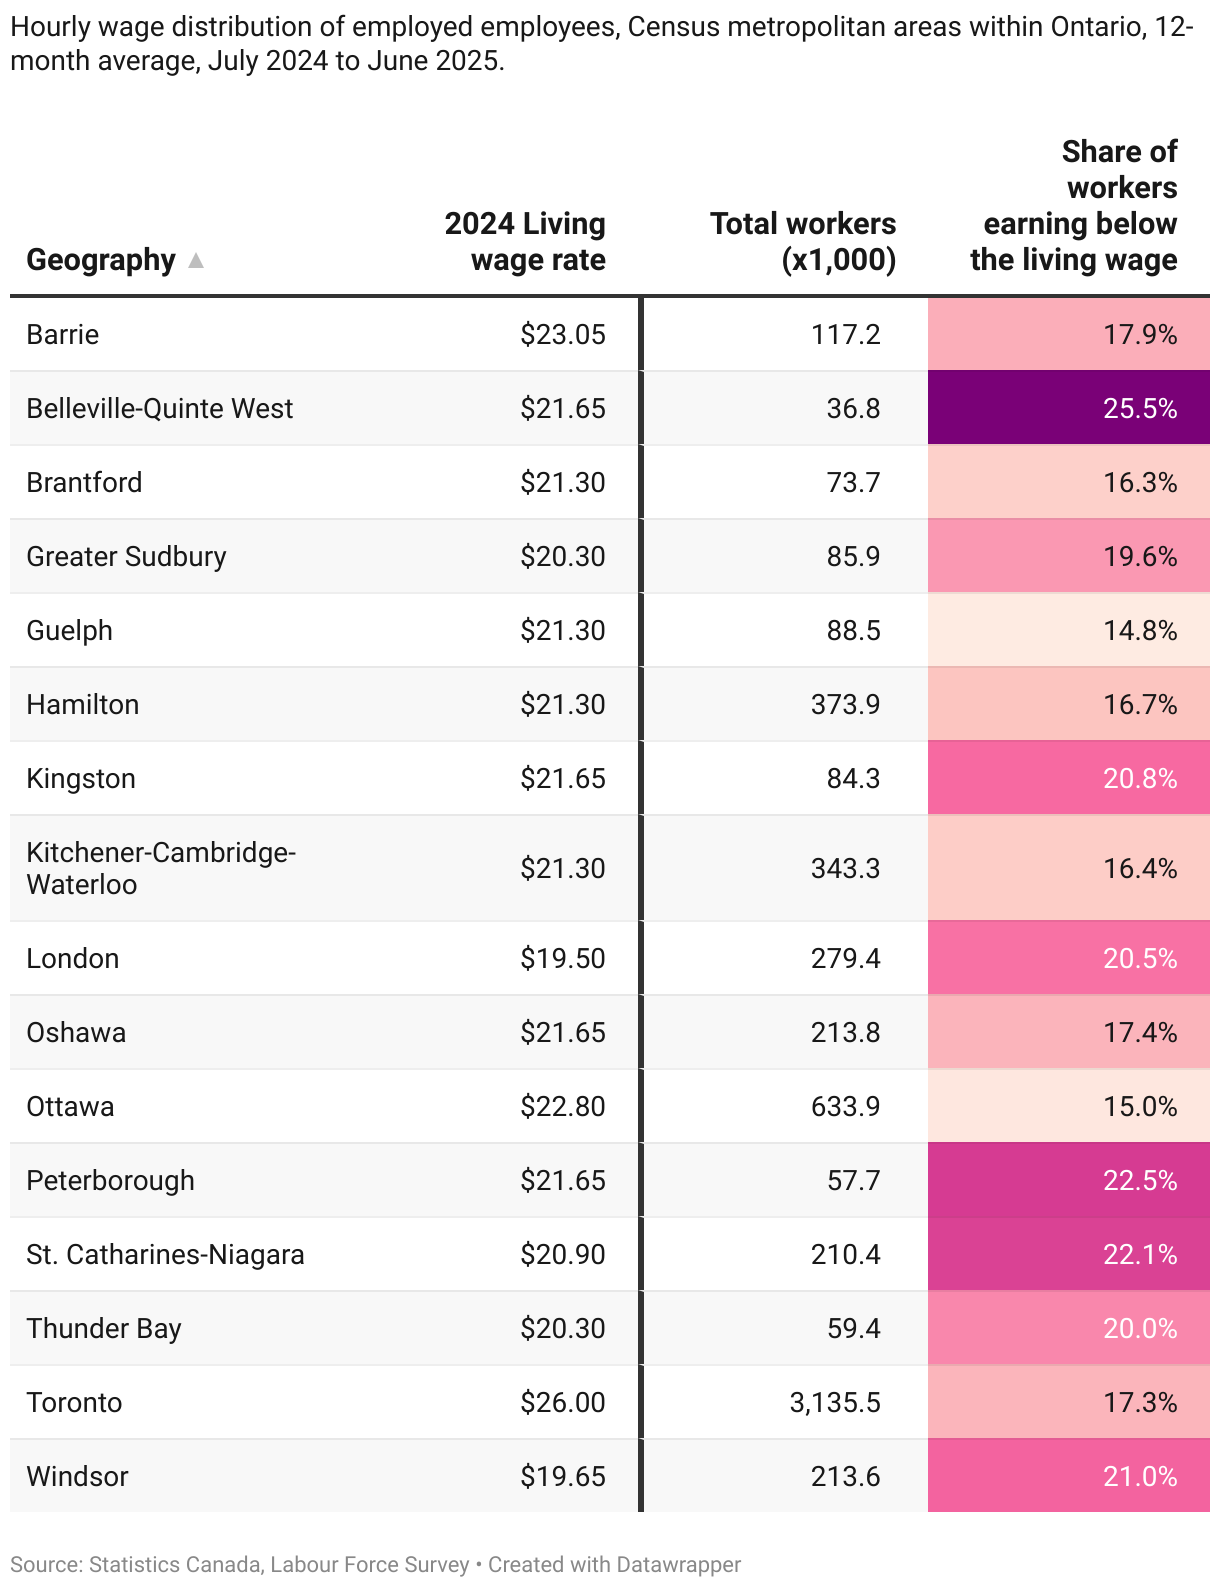
Below living wage workers, by city
The distribution of below living wage workers is not the same across the province. Along the banks of the St. Laurence River, Belleville tops the list of cities with the highest share of workers who make less than the local living wage: 25.5 per cent of that city’s workforce earning below the 2024 living wage rate of $21.65 an hour.
Ottawa is among the cities with a smaller share of workers who make less than the local living wage of $22.80 an hour: only 15 per cent of workers earn less than the living wage—due to that city’s large government employment levels and subsequent high unionization rate.
Table 4: Total workers in each city
What is a living wage exactly?
A living wage lifts workers and their families out of poverty by supplying employers with an hourly wage that they must pay in a specific geographic area so that a family can make modest ends meet. Next to the minimum wage, which remains inadequate, the living wage is a powerful tool to fight working poverty.
To calculate the living wage, the OLWN looks at all local expenses that a worker would incur.2There are 10 regions that cover the entire province, and these boundaries are based on Statistics Canada’s Economic Regions (with some modifications). Just the basic bills are covered, plus some provisions for modest community participation such as after school activities for children and family outings. Government transfers and benefits are also considered.
The calculation methodology is adapted from a framework created by the Canadian Centre for Policy Alternatives. In its current iteration, the OLWN expanded the original model of two adults supporting two small children to include a single mother and a single adult to create a weighted average of all expenses collected for the calculation.
The calculations are run every year with locally collected expenses, and these updated rates are released every November.
Work should pay the bills
This is the first examination of this kind to be done for Ontario, and we have drawn inspiration from similar efforts in B.C and Manitoba. As with those other provinces, low-paying work is concentrated among particular groups of workers—namely, women and racialized workers.
Every 1st of October, the Ontario minimum wage goes up by an amount announced that spring. Although this increase is tied to the Consumer Price Index, it is never enough to allow a full-time minimum wage worker to make ends meet—anywhere in the province. Living wage rates go up every year as well, and the gap continues to increase between the living wage and the minimum wage.
The discussion about low wages shouldn’t start and end on the minimum wage set by the province. There can be as much as an $8.40 difference between it and the calculated living wage (GTA/$26 per hour), affecting more workers from equity-seeking groups than those who are not.
Craig Pickthorne is director of communications for the Ontario Living Wage Network. Carolina Aragão is a researcher at the Ontario office of the Canadian Centre for Policy Alternatives.
We thank Iglika Ivanova, BCSPS, and Anastasia French of Living Wage BC for sharing their methodology and data that served as a model for this research.
About the authors
Carolina Aragão
Craig Pickthorne
Craig Pickthorne is Communications Coordinator, Ontario Living Wage Network.